CartoDB elections maps workshop
- Trainers:
- Jorge Sanz · jorge@cartodb.com · @xurxosanz
- Ernesto Martínez · ernesto@cartodb.com · @ernesmb
- Collaborators:
- Oriol Boix · oboix@cartodb.com · @oriolbx
- Ramiro Aznar · ramiroaznar@cartodb.com · @ramiroaznar
- Date: June 1st 2016
- http://bit.ly/160601-cdb-elections
Map Academy, tutorials and other online resources:
Materials specific on elections maps:
Further questions and troubleshooting:
- Email to support@cartodb.com.
- Some questions could be already anwered at GIS Stack Exchange
cartodbtag.
Contents
Introduction: Objective of this workshop
This workshop is meant to address the necessities of journalists starting to work with CartoDB and election maps mainly. It will focus on CartoDB editor usage and common issues as well as going a bit deeper into CartoCSS to give you an extra mile on that side to help you make better maps.
Importing datasets
Supported Geospatial Data Files
CartoDB supports the following geospatial data formats to upload vector data*:
ShapefileKMLKMZGeoJSON*CSVSpreadsheetsGPXOSMGeoPackage
Importing different geometry types in the same layer or in a FeatureCollection element (GeoJSON) is not supported. More detailed information here.
GeoPackage is a new format that has several advantages over the typical Shapefile:
- It’s just one file
- Column names can be as long as needed
- It supports all data types including dates and booleans
- It supports all geodata types and coordinate systems
[*] More detailed information about GeoJSON format here, here and here.
Common importing errors
- Dataset too large:
- File size limit: 150 Mb (free).
- Import row limit: 500,000 rows (free).
- Solution: split your dataset into smaller ones, import them into CartoDB and merge them.
- Malformed CSV:
- Solution: check termination lines, header…
- Encoding:
- Solution:
Save with Encoding>UTF-8 with BOMin Sublime Text, any other decent text editor or iconv.
- Solution:
- Shapefile missing files:
- Missing any of the following files within the compressed file will produce an importing error:
.shp: contains the geometry. REQUIRED..shx: contains the shape index. REQUIRED..prj: contains the projection. REQUIRED..dbf: contains the attributes. REQUIRED.
- Other auxiliary files such as
.sbn,.sbxor.shp.xmlare not REQUIRED. - Solution: make sure to add all required files.
- Missing any of the following files within the compressed file will produce an importing error:
- Duplicated id fields:
- Solution: check your dataset, remove or rename fields containing the
idkeyword.
- Solution: check your dataset, remove or rename fields containing the
- Format not supported:
- URLs -that are not points to a file- are not supported by CartoDB.
- Solution: check for missing url parameters or download the file into your local machine, import it into CartoDB.
- Non supported SRID:
- Solution: try to reproject your resources locally to a well known projection like
EPSG:4326,EPSG:3857,EPSG:25830and so on.
- Solution: try to reproject your resources locally to a well known projection like
Other importing errors and their codes can be found here.
Getting your data ready
Geocoding
If you have a column with longitude coordinates and another with latitude coordinates, CartoDB will automatically detect and covert values into the_geom. If this is not the case, CartoDB can help you by turning the named places into best guess of latitude-longitude coordinates:
- By Lon/Lat Columns.
- By City Names.
- By Admin. Regions.
- By Postal Codes.
- By IP Addresses.
- By Street Addresses.
Know more about geocoding in CartoDB here.
Datasets
These are the datasets we are going to use on our workshop. You’ll find them all on our Data Library:
- Spanish municipalities (
ign_spanish_adm3_municipalities_displaced_canary): This is a dataset with Spanish municipalities and the Canary Islands displaced so they are closer to the Iberian Peninsula. - Spanish provinces (
ign_spanish_adm2_provinces_displaced_canary)
For this workshop we will use this 2015 elections dataset:
- Electoral results: Use this URL to import the dataset from the Editor
http://bit.ly/1XgsUMb
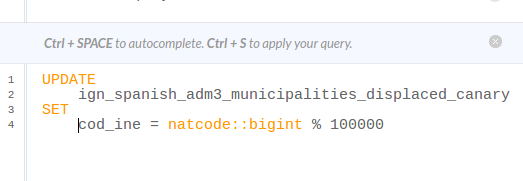
After importing the datasets, in order to be able to join the alphanumeric results with the geodata, we need to add a new column. If you are syncing the IGN dataset you need to remove the sync. Then you can add a new column and name it cod_ine. Set it as a number column. Finally you need to run this UPDATE to generate the INE code from the national code
UPDATE
  ign_spanish_adm3_municipalities_displaced_canary
SET
  cod_ine = natcode::bigint % 100000
Maybe you want to rename the table as municipalities to make your SQL and CartoCSS code easier to read.
Simple SQL operations
Before starting to make maps it’s a good idea to introduce you to a bit of the query language we use to render our maps. SQL is a language widely used to query relational databases and actually a powerful tool to analyze your data.
CartoDB allows you to interact with your datasets using the interface so you can filter, order and modify your data values directly from the editor. Sometimes it will be useful to use the SQL tray to perform more advanced tasks like formatting your data joining different tables.
Selecting all columns:
The most basic query to a table is requesting all rows and columns.
SELECT * FROM municipalities;
Selecting some columns:
Sometimes we don’t need all the columns of a table so we can select just some of them by putting their names. This is specially useful when you have big tables.
SELECT
  cartodb_id,
  cod_ine,
  nameunit,
  the_geom_webmercator
FROM municipalities;
Selecting distinct values:
If for any reason you want to know the values that a field of a table can have the DISTINCT keyword will be needed. For example the regions identifiers of Spain (17 regions plus the two autonomous cities).
SELECT
  DISTINCT codnut2
FROM municipalities;
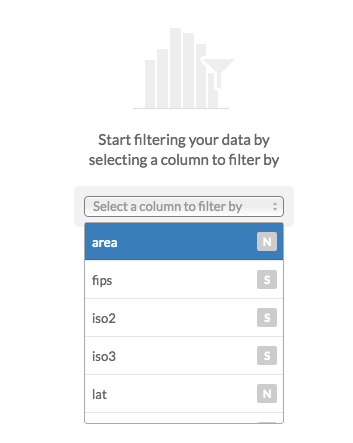
Filtering
Filtering is a common operation when working with CartoDB. With the following examples you’ll see how to subset your table according to different criteria.
Filtering numeric fields
You can use the >, <, =, != operators to restrict a numeric or a date field.
SELECT *
FROM elections_2011
WHERE participacion > 90;
Filtering character fields
Even you can use = with text fields, is more convenient to use LIKE or even better ILIKE. The former will do a case-insesitive search.
SELECT *
FROM municipalities
WHERE name ilike 'madrid';
Filtering a list of possible values
If you want to filter by several values you can use the IN keyword and pass a list of values between parenthesis and comma separated.
SELECT *
FROM elections_2011
WHERE provincia in ('Albacete','Burgos');
Combining character and numeric filters
Filters can be combined using the AND, OR and NOT keywords. If you have doubts about the operator precedence is always good idea to use parenthesis to make explicit your conditions.
SELECT *
FROM elections_2011
WHERE
  (
    provincia  = 'Sevilla' OR
    provincia  = 'Barcelona'
  )
  AND
    poblacion > 70000
  AND
    NOT ganador_2011 = 'PP';
Ordering results
Even you can order the results on the editor, sometimes it’s useful to order explicitly the results of your query by some field. By default ORDER works in ascending order (ASC) so you don’t need to specify it.
SELECT *
FROM elections_2011
WHERE ganador_2011 = 'PP'
ORDER BY
  poblacion DESC;
Limiting results
If your data is ordered, then you can limit the number of results to retrieve for example the top ten municipalities of Spain by population where Spanish PP party won.
SELECT
  nombre,
  provincia,
  poblacion
FROM elections_2011
WHERE ganador_2011 = 'PP'
ORDER BY poblacion DESC
LIMIT 10;
Making calculations
You can make calculations and run functions on your query SELECT part and also on the WHERE section. This way you can compute densities, normalize columns, format dates and numbers, etc. Next example shows how to get the number of voters multiplying the participation index by the population and how to get the population per square kilometer dividing the total population by the polygon area and multiplying by 1.000.000 to convert square meters to square kilometers.
SELECT
  *,
  participacion * poblacion / 100.0 as voters,
  poblacion / ST_Area(the_geom::geography) * 1000000 as pop_km2
FROM elections_2011
WHERE
  poblacion / ST_Area(the_geom::geography) * 1000000 > 10000;
More about mathematical functions here.
Joining datasets
It’s very common to have different datasets that we need to join to produce a map. Typically we have a geographic reference dataset (as IGN in this case) and we need to join it with some business data, like election results. To do so we use the JOIN clause where we refer to another table and make explicit the condition to join fields from one table to the other, normally using a common field. In our case we have a one to one relation, where for every municipality we will look for a row on the elections result table to take the data. There are other cases where we have a one to many relationship so we would need to aggregate data from the referenced table. A related example of the former type would be using a provinces table where we want to summarize elections results by municipality.
SELECT
  m.cartodb_id,
  m.the_geom_webmercator,
  e.codigo_municipio,
  e.nombre,
  e.edad_media,
  e.ganador_2011
FROM municipalities m
JOIN elections_2011 e
ON m.cod_ine = e.codigo_municipio;
Note the use of alias for tables and how they are used at the SELECT section.
Other useful SQL functions
Apart from doing normal calculations there are other functions you can apply to your columns. For example you can compute aggregated functions to count the nomber of records, or get the maximum, minimum and average values for a column.
SELECT
  count(*)       as counts,
  max(poblacion) as max_pob,
  min(poblacion) as min_pob,
  avg(poblacion) as avg_pob
FROM elections_2011;
This can be very useful if you group your data, for example:
SELECT
  partido_ganador_2015,
  count(*)       as counts,
  max(poblacion) as max_pob,
  min(poblacion) as min_pob,
  avg(poblacion) as avg_pob
FROM elections_2011
GROUP BY partido_ganador_2015
ORDER BY counts DESC;
ROUND and TRUNC will convert float numbers into integers, the first rounding to the nearest one. ROUND can also accept a second parameter to round to a specific decimal position. TO_CHAR is a more complex function that can be used to format numbers and dates into strings with decimal and thousand separators, any arbitrary date format, etc.
SELECT
  ROUND(1.9)     as rounded,    -- 2
  ROUND(1.193,1) as rounded2,   -- 1.2
  TRUNC(1.9)     as truncated,  -- 1
  TO_CHAR(12345.9332,'999,999.99') as formatted, -- '12,345.93'
  TO_CHAR(now(),'Day DD/MM/YY HH:mm') as today;  -- 'Wednesday 01/06/16 10:06:32'
More about the TO_CHAR function here.
Making our first map
CartoDB Editor map wizards
Analyzing your dataset… In some cases, when you connect a dataset and click on the MAP VIEW for the first time, the Analyzing dataset dialog appears. This analytical tool analyzes the data in each column, predicts how to visualize this data, and offers you snapshots of the visualized maps. You can select one of the possible map styles, or ignore the analyzing dataset suggestions.
- Simple Map
- Cluster Map
- Category Map
- Bubble Map
- Torque Map
- Heatmap Map
- Torque Cat Map
- Intensity Map
- Density Map
- Choropleth Map:
Know more about choosing the right map to make here.
Designing a base map
In this exercise on working with elections maps, the first thing to do is preparing a base map. This is necessary mainly because we are using a version of the municipalities dataset where the Canary Islands are displaced so we can’t use normal CartoDB basemaps. This base map will serve as reference background but it will also use the provinces dataset to give a better visual context and understanding of the different Spanish regions.
Create a new map and add the municipalities and the provinces datasets as two layers. The result should be like this one.
#provincias[zoom>3] {
  line-color: #fff;
  line-width: 1.5;
  polygon-opacity:0;
}
The provinces CartoCSS is just a lines symbol with transparent polygons.
#municipalities{
  polygon-fill: #E1E1E1;
  line-color:white;
  line-width:1;
  line-opacity:0.1;

  [zoom>=7]{
    line-width:.25;
    line-opacity:.7;
  }
}
Municipalities CartoCSS is a simple map symbol with a small change for zoom bigger than 6, decreasing lines opacity and width.
Other elements
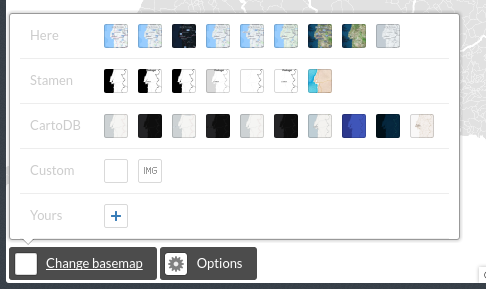
Basemaps
On this map we will use a custom color (white). Depending on your needs you can use a variety of predefined basemaps or even put your own from a third party services.
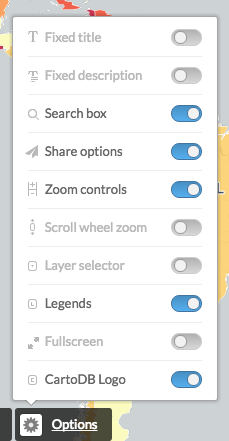
Options
Use the options to choose the functionality you want for your map, like enabling a layer selector or removing the search box.
Legend
In this case our base map won’t need a legend but for other layers you configure using the wizard CartoDB will set up a legend for you. If you do a further work on CartoCSS or just want to have a customized legend you will need to manually edit its HTML code clicking on the </> icon
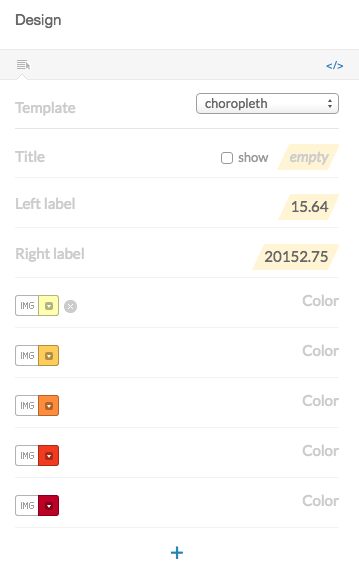
<div class='cartodb-legend choropleth'>
<div class="legend-title">Total Population</div>
<ul>
	<li class="min">
		95044.56
	</li>
	<li class="max">
		247992435.53
	</li>
	<li class="graph count_441">
	<div class="colors">
	<div class="quartile" style="background-color:#FFFFB2"></div>
	<div class="quartile" style="background-color:#FED976"></div>
	<div class="quartile" style="background-color:#FEB24C"></div>
	<div class="quartile" style="background-color:#FD8D3C"></div>
	<div class="quartile" style="background-color:#FC4E2A"></div>
	<div class="quartile" style="background-color:#E31A1C"></div>
	<div class="quartile" style="background-color:#B10026"></div>
	</div>
	</li>
</ul>
</div>
Labels
Labels are a common feature on maps, CartoDB wizard will help you to configure their settings like font, size, halo and colors.
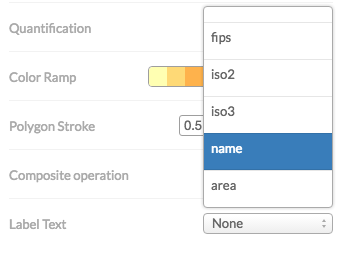
Selecting a field in the wizard will produce the following CartoCSS code to render the labels. Once you have your labels CartoCSS you can customize manually other settings like only showing them on a certain zoom range.
Map{
  buffer-size:256
}

#provincias[zoom>3] {
  line-color: #fff;
  line-width: 1.5;
  polygon-opacity:0;
}

#provincias::labels[zoom>5] {
  text-name: [nameunit];
  text-face-name: 'Lato Regular';
  text-size: 10;
  text-label-position-tolerance: 0;
  text-fill: #3f3f3f;
  text-halo-fill: #fffdfd;
  text-halo-radius: 1;
  text-dy: -10;
  text-allow-overlap: true;
  text-placement: point;
  text-placement-type: dummy;
}
This also shows an important concept for CartoCSS. you can specify more than one rendering pass for your features. This means that using the #layername::passname notation you can render more than one symbol on your features. One typical example of this feature is to render lines with more than one symbol.
#layer::background{
  line-width: 10;
  line-color: red;
}
#layer::foreground{
  line-width: 5;
  line-color: white;
}
On the above simplified CartoCSS example we use the same layer for a red background, 10 pixels widh, and then on top of it a white 5 pixels symbol.
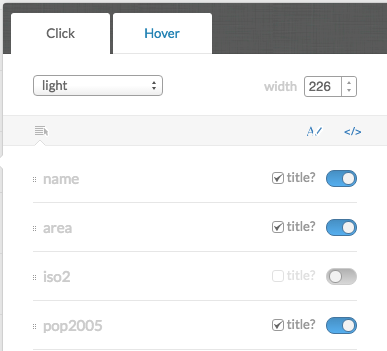
Infowindows and tooltip
Adding interactivity to our maps make them more interesting and useful to our readers. With CartoDB editor it’s easy to select the fields you want to be displayed when user clicks or hover the mouse on our features. Clicking on the </> will also show the source code for the Infowindows so we can customize their aspect and content.
<div class="cartodb-popup v2">
  <a href="#close" class="cartodb-popup-close-button close">x</a>
  <div class="cartodb-popup-content-wrapper">
    <div class="cartodb-popup-content">
      <h4>country</h4>
      <p>{{name}}</p>
      <h4>population</h4>
      <p>{{pop_norm}}</p>
      <h4>area</h4>
      <p>{{new_area}}</p>
    </div>
  </div>
  <div class="cartodb-popup-tip-container"></div>
</div>
Title, text and images
The editor allows you to add text, images and annotations to your map. An annotation is like a label that is attached to a certain position in your map so it will be displaced when you change the area displayed.
Share your map!
Finally, once you are satisfied with your creation you are ready to share your map using any of the three methods: a link to the map, the iframe code to embed it on another website or the JSON call to be used with the CartoDB.js SDK.
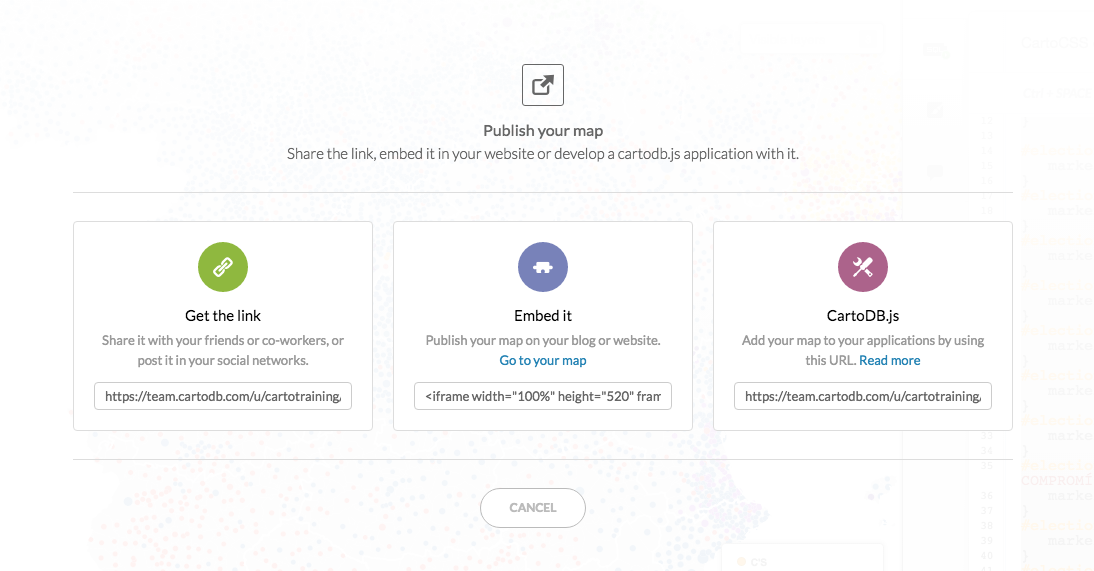
Get the link:
https://team.cartodb.com/u/cartotraining/viz/36d25ff0-2189-11e6-b39e-0e787de82d45/public_map
Embed it:
<iframe width="100%" height="520" frameborder="0" src="https://team.cartodb.com/u/cartotraining/viz/36d25ff0-2189-11e6-b39e-0e787de82d45/embed_map" allowfullscreen webkitallowfullscreen mozallowfullscreen oallowfullscreen msallowfullscreen></iframe>
Election maps
Know more about CartoCSS with our documentation and try our ColorScales!
Choropleth Map:
Before making a choropleth map, we need to normalize our target column. For that, we need to divide the population by the area of each municipality. That produces a Population Density map.
The CartoCSS section in this map is coming from our ColorScales app (see the link above), that allows to analize the data and assign the most suitable color ramp for our data. Note that to use this tool we need to put our datasets privacy as public or link.
SQL
SELECT
  m.cartodb_id,
  m.the_geom_webmercator,
  e.codigo_municipio,
  e.nombre,
  e.poblacion/(ST_Area(
    m.the_geom::geography
  )/1000000) AS pop_density
FROM cartotraining.municipalities m
JOIN cartotraining.elections_2011 e
ON m.cod_ine = e.codigo_municipio;
CartoCSS
/** choropleth visualization */
/** Jenks scale */

@color0: #f3e79b;
@color1: #f9b281;
@color2: #eb7f86;
@color3: #b85f9a;
@color4: #5c53a5;

#elections_2011{
  polygon-opacity: 0.9;
  polygon-fill: @color0;
  line-opacity: 1;
  line-width: 0.5;
  line-color: lighten(@color0,5);

  [pop_density>0]{
    polygon-fill: @color0;
    line-color: lighten(@color0,5);
  }
  [pop_density>8.07419296338199]{
    polygon-fill: @color1;
    line-color: lighten(@color1,5);
  }
  [pop_density>28.3464260803082]{
    polygon-fill: @color2;
    line-color: lighten(@color2,5);
  }
  [pop_density>209.091331347213]{
    polygon-fill: @color3;
    line-color: lighten(@color3,5);
  }
  [pop_density>1560.90092390169]{
    polygon-fill: @color4;
    line-color: lighten(@color4,5);
  }
}
Graduated symbols + Category map
Take a look on this excellent blog post by Mamata Akella regarding how to produce proportional symbols maps. The easiest ones being buble maps since it’s directly supported by CartoDB wizards. The other type, the graduated symbols where you compute the radius of the symbol to be used later on the CartoCSS section needs a bit of SQL computation but nothing hard

As the formula above states, we need the maximum value for the population column in order to calculate the new size column. We could get that running an auxiliary query with max() aggregation function, or simply going to DATA VIEW and ordering the column by DESCENDING values. That formula would start symbol sizes at 0 pixels so it’s a good idea to add a fixed minimal size of 4 pixels.
SQL
SELECT
  m.cartodb_id,
  ST_Centroid(m.the_geom_webmercator) AS the_geom_webmercator,
  e.codigo_municipio,
  e.nombre,
  e.partido_ganador_2015,
  e.poblacion,
  4+32*sqrt(poblacion)/sqrt(3165235) AS size
FROM
  cartotraining.municipalities m
JOIN cartotraining.elections_2011 e
ON m.cod_ine = e.codigo_municipio
ORDER BY poblacion DESC;
CartoCSS
#elections_2011 {
   marker-fill-opacity: 0.9;
   marker-line-color: #FFF;
   marker-line-width: 0.25;
   marker-line-opacity: 1;
   marker-placement: point;
   marker-type: ellipse;
   marker-width: [size];
   marker-allow-overlap: true;
   marker-fill: #DDDDDD;

  [partido_ganador_2015="C's"]       {marker-fill: #FF9900; }
  [partido_ganador_2015="DL"]        {marker-fill: #FFCC00; }
  [partido_ganador_2015="EAJ-PNV"]   {marker-fill: #B2DF8A; }
  [partido_ganador_2015="EH BILDU"]  {marker-fill: #33A02C; }
  [partido_ganador_2015="EN COMÚ"]   {marker-fill: #7B00B4; }
  [partido_ganador_2015="ERC-CATSI"] {marker-fill: #E31A1C; }
  [partido_ganador_2015="PODEMOS"]   {marker-fill: #3B007F; }
  [partido_ganador_2015="PP"]        {marker-fill: #3E7BB6; }
  [partido_ganador_2015="PSOE"]      {marker-fill: #F84F40; }
  [partido_ganador_2015="PODEMOS-COMPROMÍS"] {marker-fill: #A53ED5; }
}
Percentage for one specific party
We made a standard choropleth map using the vote percentage for one specific party.
SQL
SELECT
  m.cartodb_id,
  m.the_geom_webmercator,
  e.codigo_municipio,
  e.nombre,
  e.porcentaje_psoe,
  e.participacion
FROM
  cartotraining.municipalities m
JOIN cartotraining.elections_2011 e
ON m.cod_ine = e.codigo_municipio;
CartoCSS
#elections_2011{
  polygon-fill: #F2D2D3;
  line-color: #FFF;
  line-width: 0.5;
  line-opacity: 0.5;
}

#elections_2011 [ porcentaje_psoe <= 77.78] {polygon-fill: #C1373C; }
#elections_2011 [ porcentaje_psoe <= 40.48] {polygon-fill: #CC4E52; }
#elections_2011 [ porcentaje_psoe <= 29.93] {polygon-fill: #D4686C; }
#elections_2011 [ porcentaje_psoe <= 21.28] {polygon-fill: #EBB7B9; }
#elections_2011 [ porcentaje_psoe <= 12.16] {polygon-fill: #F2D2D3; }
Winner party + Population Density
In this case we are going to use the winner party in each municipality to create a category map. To add another dimension to our map, we are goint to use the opacity as a symbol for the population density.
In order to do so, we are going to use the same formula than before, and add a new set of CartoCSS rules based on the pop_density column.
SQL
SELECT
  m.cartodb_id,
  m.the_geom_webmercator,
  e.codigo_municipio,
  e.nombre,
  e.partido_ganador_2015,
  e.poblacion,
  e.poblacion/(
    ST_Area(m.the_geom::geography)/1000000
  ) AS pop_density
FROM
  municipalities m
JOIN elections_2011 e
ON m.cod_ine = e.codigo_municipio;
CartoCSS
#elections_2011 {
   polygon-opacity: 0.7;
   line-color: #FFF;
   line-width: 0.25;
   line-opacity: 0.5;
   polygon-fill: #DDDDDD;

  [pop_density<=100]{polygon-opacity:1.0}
  [pop_density<=90] {polygon-opacity:0.9}
  [pop_density<=80] {polygon-opacity:0.8}
  [pop_density<=70] {polygon-opacity:0.7}
  [pop_density<=60] {polygon-opacity:0.6}
  [pop_density<=50] {polygon-opacity:0.5}
  [pop_density<=40] {polygon-opacity:0.4}
  [pop_density<=30] {polygon-opacity:0.3}
  [pop_density<=20] {polygon-opacity:0.2}
  [pop_density<=10] {polygon-opacity:0.1}
}

#elections_2011[partido_ganador_2015="C's"]       {polygon-fill: #ff9900; }
#elections_2011[partido_ganador_2015="DL"]        {polygon-fill: #ffcc00; }
#elections_2011[partido_ganador_2015="EAJ-PNV"]   {polygon-fill: #B2DF8A; }
#elections_2011[partido_ganador_2015="EH BILDU"]  {polygon-fill: #33A02C; }
#elections_2011[partido_ganador_2015="EN COMÚ"]   {polygon-fill: #7b00b4; }
#elections_2011[partido_ganador_2015="ERC-CATSI"] {polygon-fill: #850200; }
#elections_2011[partido_ganador_2015="PODEMOS"]   {polygon-fill: #3b007f; }
#elections_2011[partido_ganador_2015="PP"]        {polygon-fill: #3e7bb6; }
#elections_2011[partido_ganador_2015="PSOE"]      {polygon-fill: #f84f40; }
#elections_2011[partido_ganador_2015="PODEMOS-COMPROMÍS"] {polygon-fill: #a53ed5; }
Comparing results from previous elections
In this map we are going to find those municipalities in which the 2015 winner party is different than 2011. For that, the CASE conditional funcion will do the trick.
So, we select a column called new_winner that will have a NULL value if 2015 winner is the same than 2011. If the winner party is different, new_winner will contain the name of the winner party.
After that, a very easy Category Map will suit our needs.
SQL
SELECT
  m.cartodb_id,
  m.the_geom_webmercator,
  e.codigo_municipio,
  e.nombre,
  e.poblacion,
  e.ganador_2011,
  e.partido_ganador_2015,
  CASE
    WHEN ganador_2011 ILIKE partido_ganador_2015 THEN NULL
    ELSE partido_ganador_2015
  END new_winner
FROM
  municipalities m
JOIN elections_2011 e
ON m.cod_ine = e.codigo_municipio;
CartoCSS
#elections_2011 {
   polygon-opacity: 0.7;
   polygon-fill: #DDD;
   line-color: #FFF;
   line-width: 0.5;
   line-opacity: 0.5;
}

#elections_2011[new_winner="C's"] {polygon-fill: #ff9900; }
#elections_2011[new_winner="DL"] {polygon-fill: #ffcc00; }
#elections_2011[new_winner="EAJ-PNV"] {polygon-fill: #B2DF8A; }
#elections_2011[new_winner="EH BILDU"] {polygon-fill: #33A02C; }
#elections_2011[new_winner="EN COMÚ"] {polygon-fill: #7b00b4; }
#elections_2011[new_winner="ERC-CATSI"] {polygon-fill: #850200; }
#elections_2011[new_winner="PODEMOS"] {polygon-fill: #3b007f; }
#elections_2011[new_winner="PODEMOS-COMPROMÍS"] {polygon-fill: #a53ed5; }
#elections_2011[new_winner="PP"] {polygon-fill: #3e7bb6; }
#elections_2011[new_winner="PSOE"] {polygon-fill: #f84f40; }