Tour of CartoDB APIs Harvard Workshop
Introduction to the CartoDB interface
This page can always be found at: http://bit.ly/cdb-harvard
- Tour of dashboard
- Common data
- Uploading data
- Tour of table and map view
- Publishing maps
- Public profile
Creating your accounts
Set you up with accounts here, https://cartodb.com/signup?plan=academy. This will give you a free upgrade to our student plan, since today, we are all students :)
Your first map in 30 seconds!
Today we are going to make a map of a very exciting topic! The other day I stumbled upon a really fun dataset of this guy,
Spencer the cat!

I found this data in Movebank. The first thing we are going to do is import this dataset into our accounts.
alternative:
Cut&paste the url:
https://dl.dropboxusercontent.com/u/1307405/CartoDB/spencer_the_cat.geojson
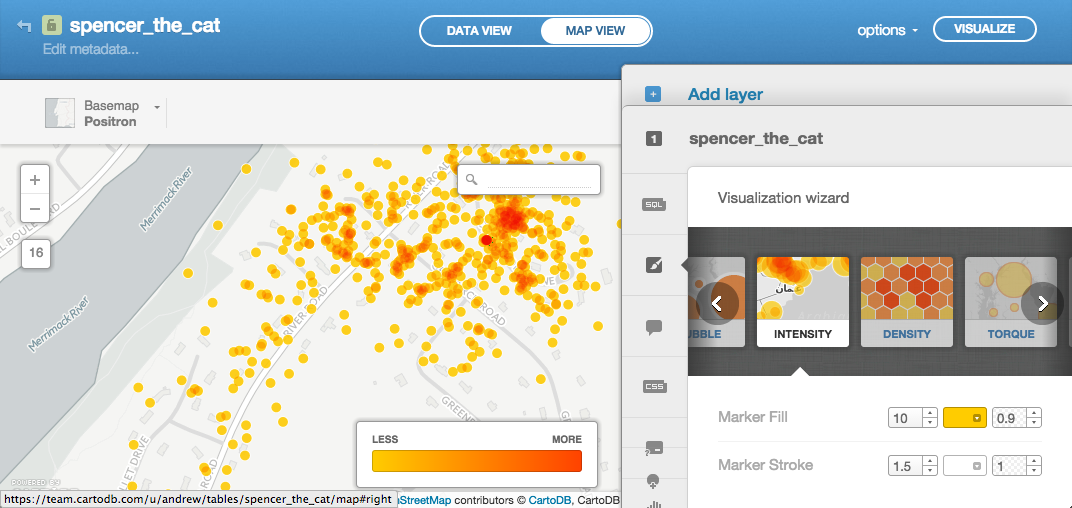
Now, let’s use Spencer to take a look at a few things.
- Table and map view
- Thematic maps!
- Custom styling data
Introduction to CartoCSS
#spencer_the_cat{
  marker-fill: transparent;
  marker-width:24;
  marker-line-color: #FFFFFF;
  marker-line-width: 2.0;
  marker-line-opacity: 1.5;
  marker-fill-opacity: 0.9;
  marker-comp-op: src;
  marker-type: ellipse;
  marker-placement: point;
  marker-allow-overlap: true;
  marker-clip: false;
}
Introduction to SQL
SELECT cartodb_id, the_geom, the_geom_webmercator FROM spencer_the_cat
SELECT 'hi' as hello FROM spencer_the_cat
SELECT *, date_part('dow',study_local_timestamp) as d
FROM spencer_the_cat
dow here means ‘day of week’. 0-6 Sunday is 0
Let’s see what Spencer does on Mondays
SELECT *, date_part('dow',study_local_timestamp) as d
FROM spencer_the_cat
WHERE date_part('dow',study_local_timestamp) = 1
SELECT ST_MakeLine(the_geom_webmercator) as the_geom_webmercator
FROM spencer_the_cat
SELECT ST_MakeLine(the_geom_webmercator) as the_geom_webmercator FROM spencer_the_cat
WHERE date_part('dow',study_local_timestamp) = 1
Or! Let’s get all days and then use colors to distinguish them
SELECT
  ST_MakeLine(the_geom_webmercator) as the_geom_webmercator,
  date_part('dow',study_local_timestamp) as d
FROM spencer_the_cat
GROUP BY date_part('dow',study_local_timestamp)
Writing data
UPDATE spencer_the_cat SET hod = date_part('hour',study_local_timestamp)
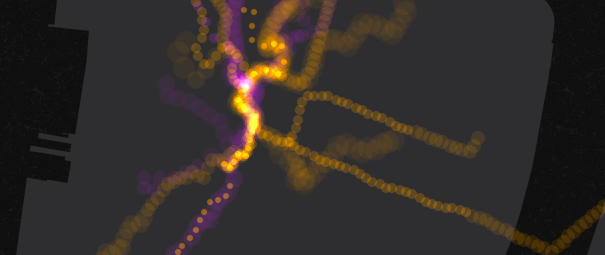
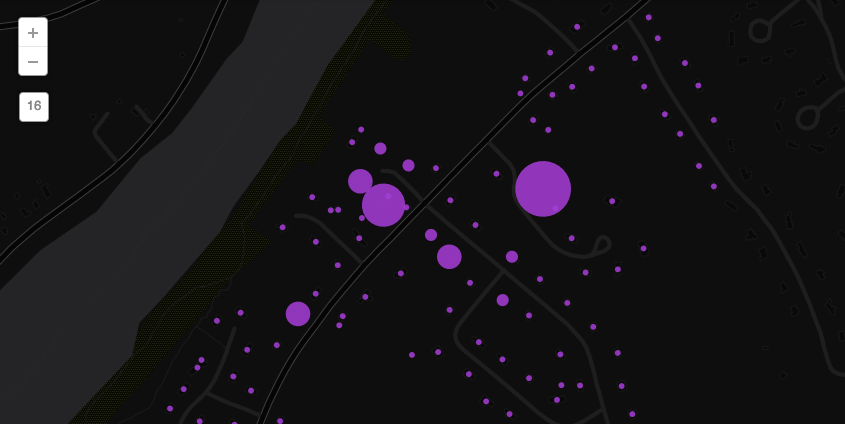
Torque!
A quick look at Torque
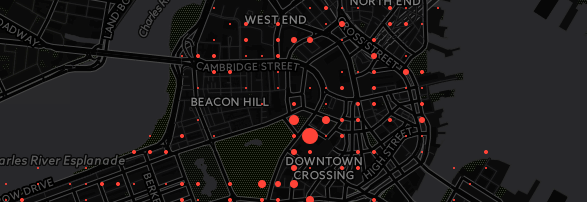
Point torque
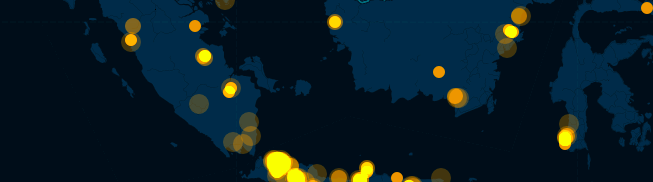
Categorical torque
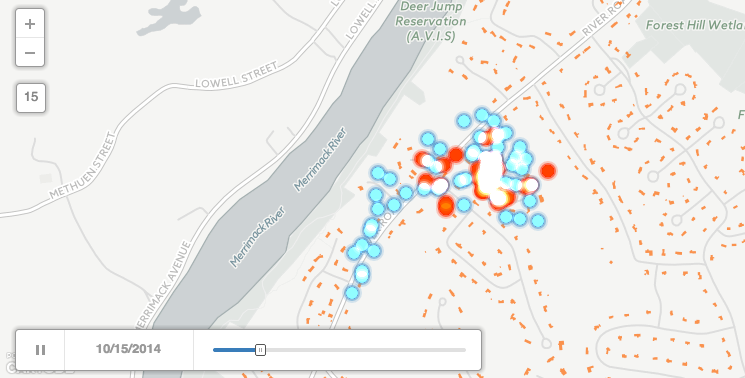
Temporal bubbles
Cumulative bubbles
Method for creating the last two
Now our own Torque
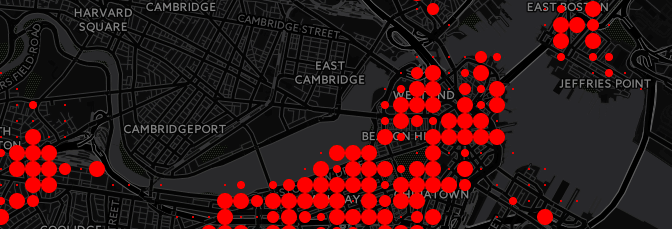
Guessing Spencer’s house
First, let’s take a look at one of my favorite datasets from MassGIS, the Building Structures dataset. We can all download Cambridge and upload the file to our accounts.
Let’s rename the file, cambridge_buildings
We can do some different things with polygons, let’s take a look.
More dynamic SQL
CDB_LatLng
SELECT
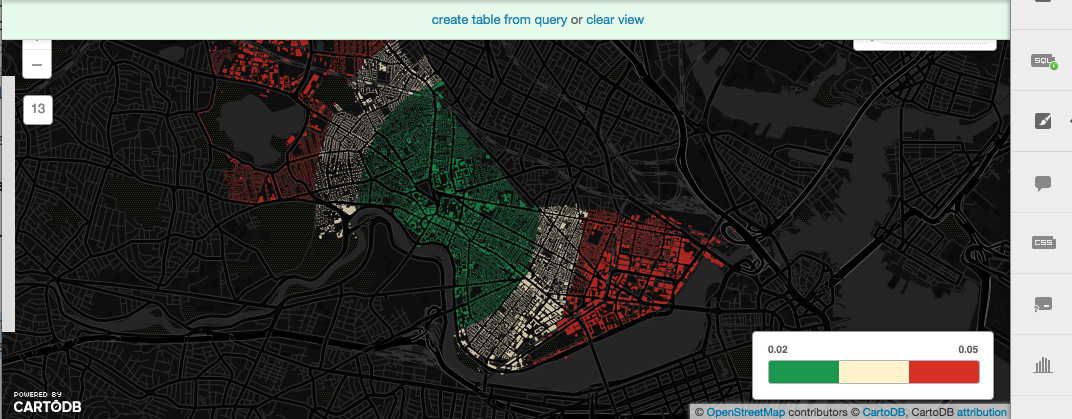
*, ST_Distance(the_geom, CDB_LatLng(42.374444, -71.116944)) d
FROM cambridge_buildings
a map from dynamic sql
Order by distance
SELECT * FROM cambridge_buildings
ORDER BY the_geom <-> CDB_LatLng(42.374444, -71.116944) LIMIT 65
A quick side journey into the SQL API
If you are building an application, you can actually do the same request over your API and get CSV, JSON, or GeoJSON results. Lets’ look at the default JSON,
http://{username}.cartodb.com/api/v2/sql?q={SQL STATEMENT}
For example,
http://andrew.cartodb.com/api/v2/sql?q=SELECT * FROM cambridge_buildings ORDER BY the_geom <-> CDB_LatLng(42.374444, -71.116944) LIMIT 10
It’s awesome. You can do it from JavaScript and it doesn’t even need to be about maps. Take a look at this column search built off a CartoDB table with placenames.
On to Spencer
We’ll upload a second dataset now. This time, building footprints from MassGIS website. Let’s download Andover, https://gist.github.com/andrewxhill/7c1efd9bdead734010b0. Now import it into your account.
Create a two layer visualization
Delete unneeded buildings
DELETE FROM structures_poly_9
WHERE NOT
  (SELECT ST_Extent(the_geom) FROM spencer_the_cat) && the_geom
Count spencer visits
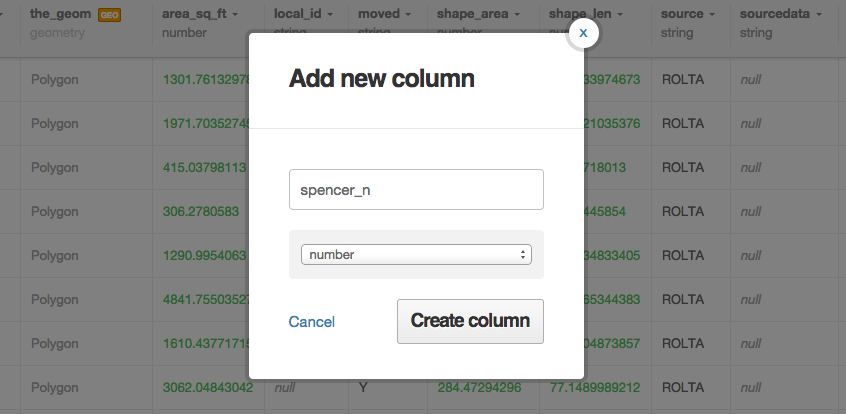
Add a new column called spencer_n of type numeric in our structures_poly_9 table.
Spatial analysis of Spencer :)
Let’s count how many times spencer was likely inside each house,
UPDATE structures_poly_9
SET spencer_n =
  (SELECT count(*)
   FROM spencer_the_cat
  WHERE ST_Intersects(the_geom, structures_poly_9.the_geom))
Let’s look at house ‘touches’
SELECT
  cartodb_id,
  ST_MakeLine(
    the_geom_webmercator,
    ST_Centroid((
      SELECT the_geom_webmercator FROM structures_poly_9
      ORDER BY the_geom<->spencer_the_cat.the_geom
      LIMIT 1))
  ) AS the_geom_webmercator,
  hod
FROM
  spencer_the_cat
CartoDB.js
Let’s all start with the same template, you can download an index.html file here,
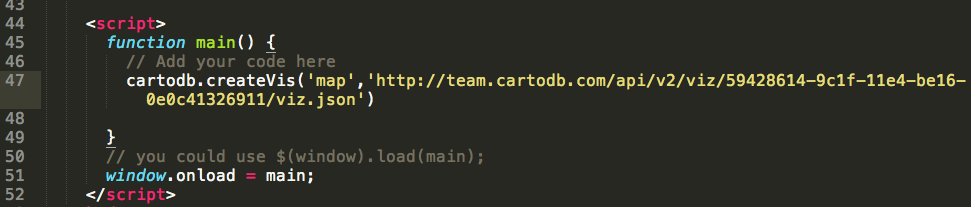
The simplest CartoDB.js map - createVis
A map in one line of JavaScript
cartodb.createVis('map','http://team.cartodb.com/api/v2/viz/f6b0e824-a2fe-11e4-8f13-0e018d66dc29/viz.json');
Now, add your own vis.json URL.
Using an existing Leaflet map
We often want to make layers for maps in CartoDB and add them to our existing maps or projects. In this example, let’s create a webpage with a blank leaflet map. We’ll use one of the free to use CartoDB Basemaps for this.
First, make sure you delete the line we added above and create a leaflet map object,
var map = new L.Map('map', {
    zoomControl: false,
    center: [42.67, -71.23],
    zoom: 15
});
Next, add a CartoDB Basemap
var layer = L.tileLayer('http://{s}.basemaps.cartocdn.com/dark_nolabels/{z}/{x}/{y}.png', {
attribution: '© <a href="http://www.openstreetmap.org/copyright">OpenStreetMap</a> contributors, © <a href="http://cartodb.com/attributions">CartoDB</a>'
}).addTo(map);
Let’s save the file and refresh.
Using the createLayer method, we can now add our map of Spencer. Let’s start with just a simple point map of Spencer.
cartodb.createLayer(map, '{your-vis-json-url-here}')
    .done(function(layer) {
        // Do further things here
    })
    .addTo(map);
Add interactivity
You can add interactivity in the Editor very easily, but for maps you are creating on the fly in CartoDB.js, you can also add custom interactivity.
var lots = layer.getSubLayer(0);
lots.setInteractivity('cartodb_id, hod');
lots.setInteraction(true);
Add custom interaction
You can use cursor events on your polygons (e.g. featureClick, featureOver, featureOut) to create your own actions on your webpage. Let’s log the Elevation value for any lot we hover over
lots.on('featureOver', function(e, pos, pixel, data) {
console.log("Hour: " + data.hod);
});
Integrating interfaces
Using that button, Do Something, we can let the user interact with the data on the map in ways that no other service on the web can do it! Let’s start with the basics…
Create button to set filter
Here, let’s create a button so that when a user clicks it, we filter to just Spencer’s activities in the evening.
var spencer = layer.getSubLayer(0);
$('#btn li').click(function(){
    var new_sql = "SELECT * FROM spencer_the_cat WHERE hod > 18";
    spencer.setSQL(new_sql);
});
Change the button to modify the style
Just like changing the SQL on the fly, we can change the entire style of our map:
var spencer = layer.getSubLayer(0);
$('#btn li').click(function(){
    var new_cartocss = "#spencer_the_cat{marker-fill-opacity: 0.8; marker-line-width: 0; marker-width: 10; marker-fill: #F2D2D3; marker-allow-overlap:true; [hod > 18]{marker-fill: #3232FF;}}";
    spencer.setCartoCSS(new_cartocss);
});
Style and SQL at the same time
var spencer = layer.getSubLayer(0);
$('#btn li').click(function(){
    var new_sql = "SELECT * FROM spencer_the_cat WHERE hod > 18";
    var new_cartocss = "#spencer_the_cat{marker-fill-opacity: 0.8; marker-line-width: 0; marker-width: 10; marker-fill: #F2D2D3; marker-allow-overlap:true; [hod > 18]{marker-fill: #3232FF;}}";
    spencer.set({sql: new_sql, cartocss: new_cartocss});
});
Add an Undo button
Of course, it would be handy if we let our users return to the default map after they click the button. Let’s make that happen.
var spencer = layer.getSubLayer(0);
var state = 0;
$('#btn li').click(function(){
    if (state == 0) {
        state = 1;
        $("#first").text('undo');
        var new_sql = "SELECT * FROM spencer_the_cat WHERE hod > 18";
        var new_cartocss = "#spencer_the_cat{marker-fill-opacity: 0.8; marker-line-width: 0; marker-width: 10; marker-fill: #F2D2D3; marker-allow-overlap:true; [hod > 18]{marker-fill: #3232FF;}}";
        spencer.set({sql: new_sql, cartocss: new_cartocss});
    } else {
        state = 0;
        $("#first").text('Do Something');
        var new_sql = "SELECT * FROM spencer_the_cat";
        var new_cartocss = "#spencer_the_cat{marker-fill-opacity:0.8;marker-line-color:#FFF;marker-line-width:0;marker-line-opacity:1;marker-width:10;marker-fill:#C1373C;marker-allow-overlap:true;}";
        spencer.set({sql: new_sql, cartocss: new_cartocss});
    }
});
