Styling and Map Examples Pratt Ongoing Projects Workshop
Intermediate Styling and Features in CartoDB
Personal Projects Workshop
This workshop is designed to leave a lot of flexible space to work on personal projects, tackle challenges, and achieve a safe project-need-specific learning experience with the help of experts.
About me:
- Map Science & Community Intern at CartoDB
- @namessanti on Twitter
- Creative Director for Cohabitation Strategies
Today we will explore various intermediate methods and features using the CartoDB UI and our JavaScript API CartoDB.js by exploring specific map examples and how the outcome is achieved.
Diving in – CartoDB Editor
Check out this map:
A few things to note about the map:
- The data was scraped using the Kimono API builder.
- The title and text boxes were made using the ‘add element’ icon on the top right of the editor.
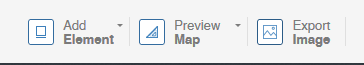
- Here you can also add annotations. Check out this “After The Fall” map to see how they can be used.
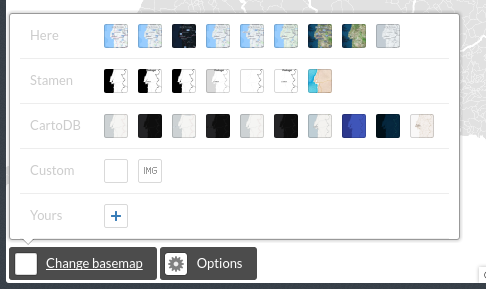
- This map has no basemap, but uses another data layer as the base. You can change your base maps, add your own images, or remove the base map using the “base map selector” in the lower left corner of the editor.
- The stylings of the map was done entirely in CartoCSS
- The Torque animation elements are clickable. This is not a functionality available in Torque at the moment but you can duplicate the same layer, make it transparent on top of your animation, and style the infowindows accordingly
- There is a header image embedded into the infowindows on click
Let’s take a moment to check out what this map looks like in the data table and in the editor.
Take this time to ask questions about style, technique, or anything else that may come to mind regarding your own project or how I achieved certain elements in the map.
What’s next?
Check out this map:
This map combines multiple layers, and many of the features were created using the built in “Add feature” function

- Create a new layer in your project and experiment with making new features.
- Take a look at what they look like in the data table. You can add columns with information to these spatial features in order to generate your own styles, categories, or info windows.
Realtime Maps
Check out this map:
- It updates every hour to let you know where storms have been reported and where there they’re headed. This is done by importing data from a URL.
- real-time sync is available only in paid accounts (unless you contact us as and you’re doing something super awesome).
- This map also contains a custom legend created using the built in HTML editor.
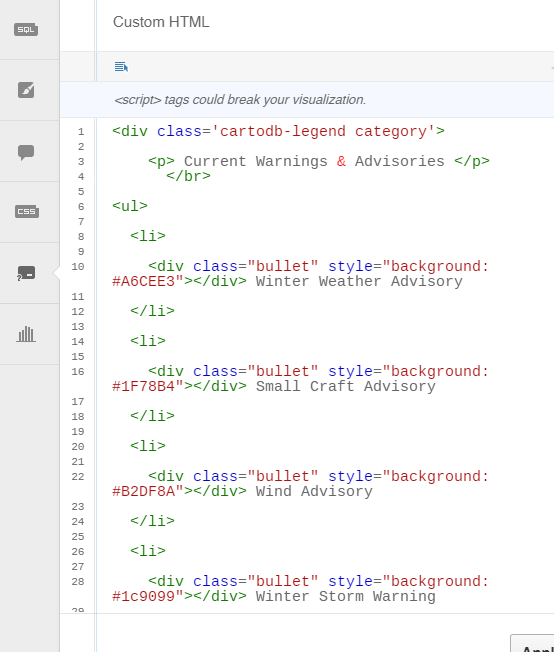
Let’s take another moment for questions and to tackle challenges. While I understand not everyone is HTML-savvy, a quick tutorial on Codecademy will get you going in no time : )
##CartoDB.js
###Check out this map.
- The data was styled in the CartoDB Editor, then the viz.json file was pulled out using the ‘share’ button in the upper right hand corner.
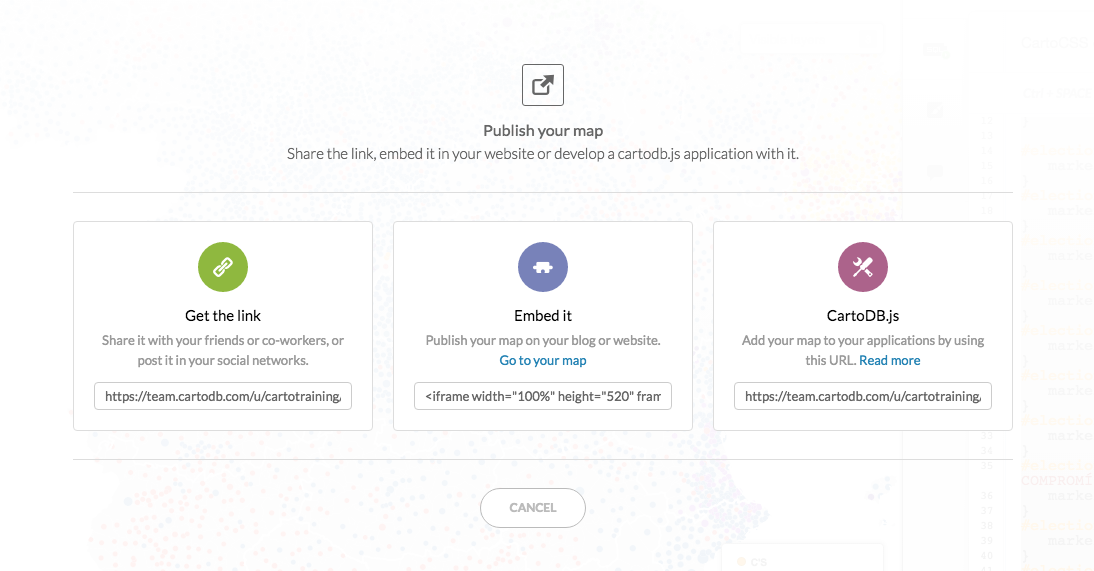
- CartoDB.js was used to create a layer selector, and toggle map legends, which were also created in the JavaScript
Feel free to check out our documentation about CartoDB.js to get started coding your own maps
Here are some examples of additional data stories:
Don’t be afraid to explore the possibilities behind the User Interface, APIs, and cartodb.js using these resources:
- The CartoDB Academy is great for recapping the basics, starting to use our APIs, and growing your design capabilities
- This handy CartoCSS Reference Sheet is a quick guide for beginners to CartoCSS
- If you have any questions or need any help, I am also available as a resource! Please email me at santiago@cartodb.com
Data
geox4.neocities.org/ is a a great resource for accessing data across the web. It is organized into the following sections: International Resources, US-based Resources, and NYC-based Resources. Remember - shapefiles (.shp) must be zipped with all the files before importing to CartoDB.
The NYC Open Data Portal is a place where you can search for and download data about NYC. Simply click on “Export” at the top right when a data set is open to download the data as a shapefile or CSV.
Happy Mapping!