ISM CARTO Workshop Análisis y visualización de datos ambientales con CARTO
- Trainer: Ramiro Aznar · ramiroaznar@carto.com · @ramiroaznar
- November 11th, 2016
- Data Analysis and Visualization for environmental professionals
- Instituto Superior de Medio Ambiente (ISM) event
- http://bit.ly/161011-ism-carto
Introduction
Prerequisites
- Laptop
- A modern browser (Google Chrome would be perfect)
Map Academy, tutorials and other online resources
You can take a look on those resources if you want to warm up with CARTO
Further questions and troubleshooting
- Email to support@carto.com.
- Some questions could be already anwered at GIS Stack Exchange
cartotag.
Contents
Accounts set up
- The instructor will provide you a user and passwor to access your account
- Log into your
ismcartoXXaccount going tohttps://ismcartoXX.carto.com
Introduction to CARTO

Slides available here.
Builder
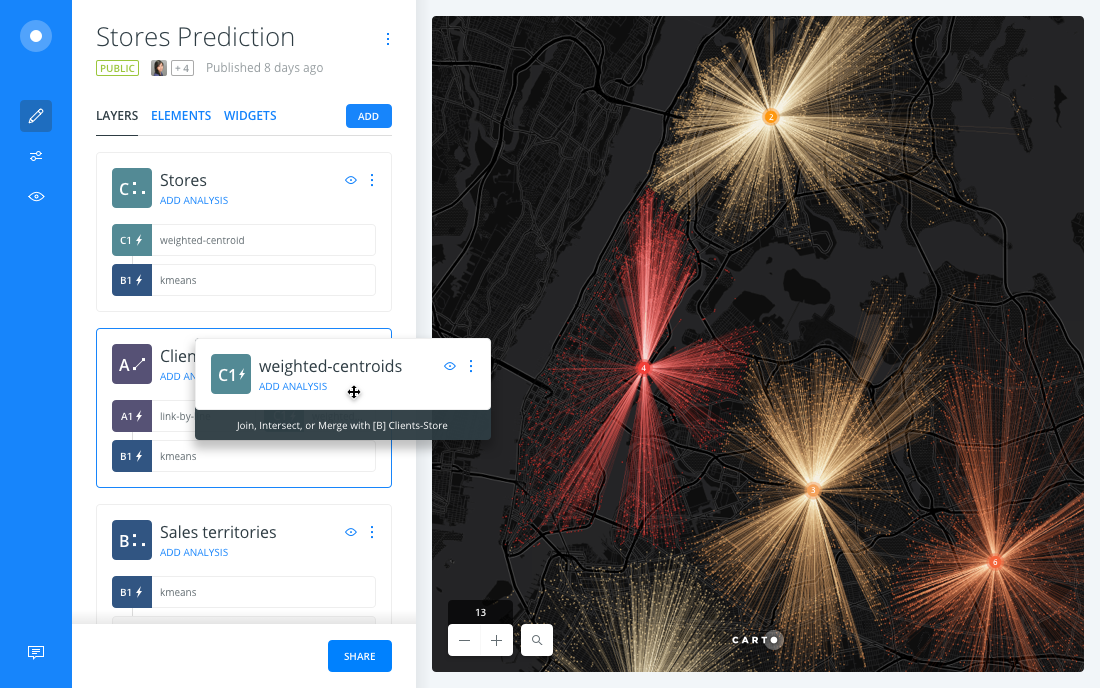
The BUILDER is the new main web interface to interact with the CARTO platform. It’s a product aimed to everyone willing to manage, analyze and visualize geospatial information. It’s highly focused on usability, with a friendly graphical interface that unlocks all the power of the CARTO ENGINE without having to know all the details on underlying technologies such as PostGIS or CartoCSS.
Demo
With this demo we want to answer the following question: what is the river more polluted within the Comunidad de Madrid?
1. Import datasets and create a map
1. 1. Import datasets into CARTO
- Download the following datasets* from the
builder-demoaccount:vertidos(as csv file), pollution point sources.rios(as shapefile file), Spanish rivers.subcuencas(as shapefile), small Spanish rivers watersheds.
-
Import the three datasets (one by one) into your CARTO account.
- Select
vertidos,riosandsubcuencasfrom your datasets dashboard, click onNEW MAP.
*These datasets were previously download from the MARM website.
1. 2. Rename map title and layers
- Rename map title to
Vertidos, ríos y subcuencas. - Order the layers: first
vertidos, thenriosand at the bottom,subcuencas. - Rename layers:
vertidosasVertidos,riosasRíos,subcuencasasSubcuencas.
2. Style Vertidos layer and add your first widgets
2. 1. Add your first widgets
- Click on
Vertidoslayer. - On the
DATAtaba, you will be able to see an overview of all the fields that this layer contains.- Activate the checkbox of
points count. - Click on
EDIT. - Rename the widget as
Número de vertidos.
- Activate the checkbox of
This widget is a formula which counts the number of points (vertidos) within the visualization bounding box. Try to add a widget which filters rivers by name.
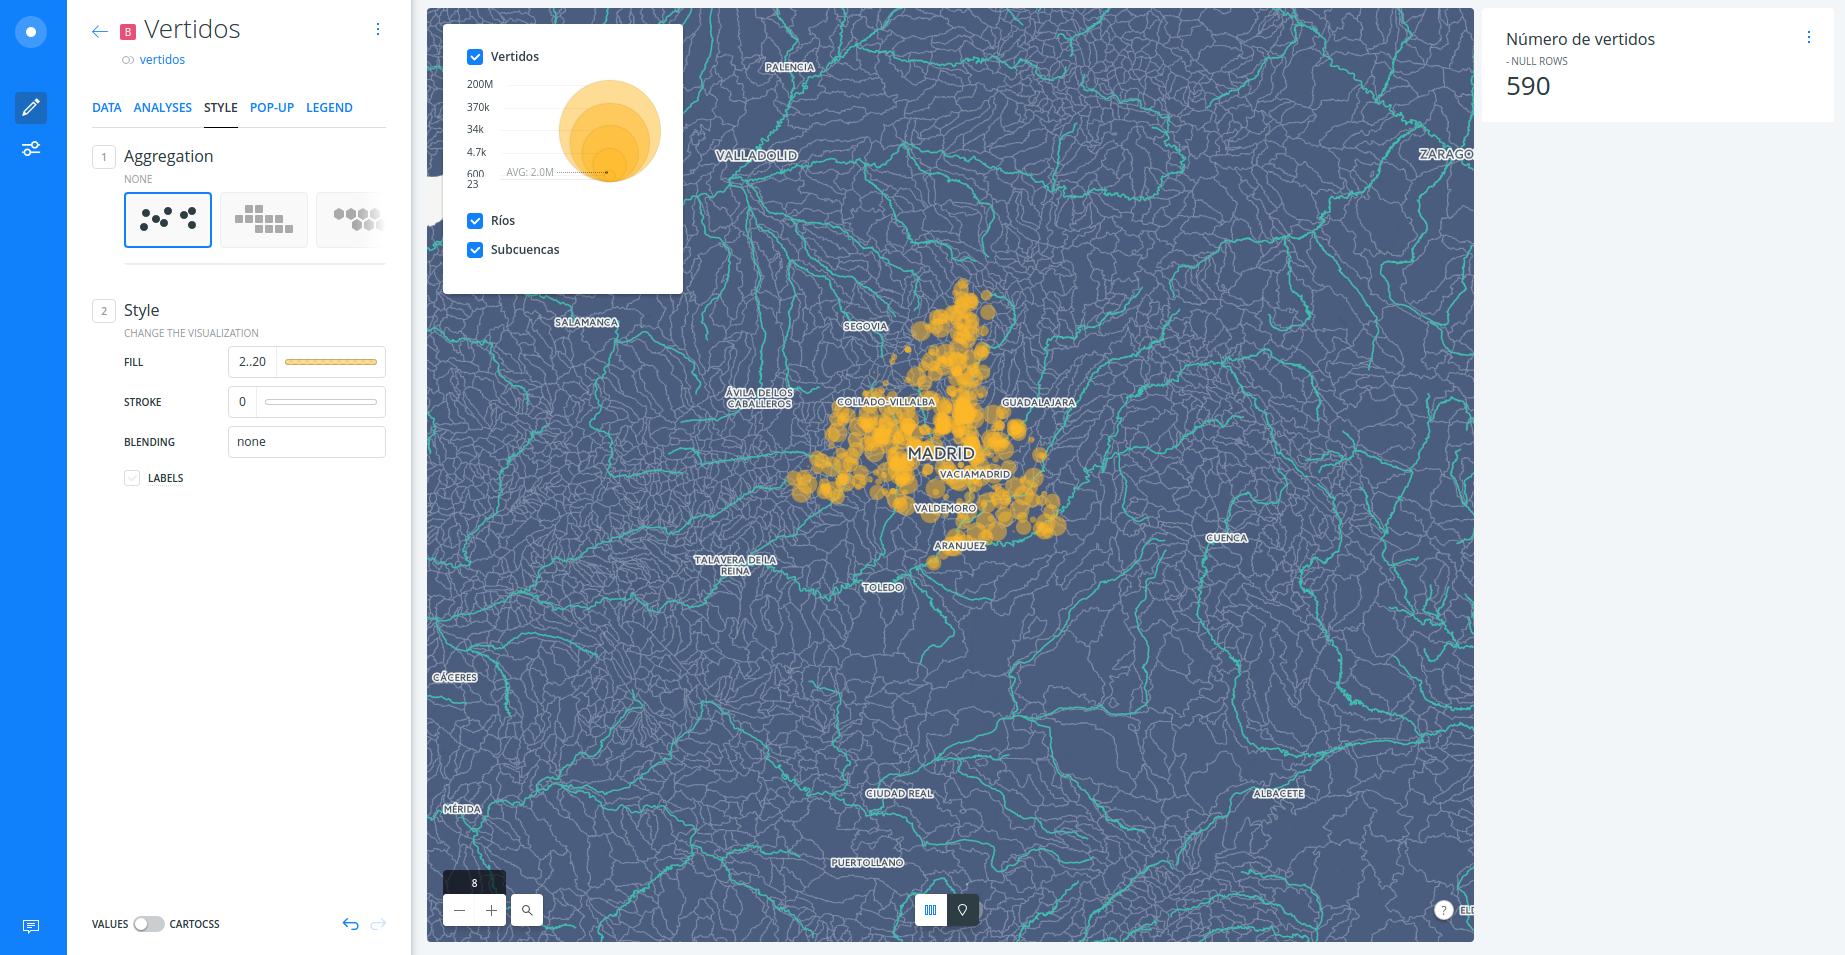
2. 1. Style Vertidos layer
- Back to the main menu, in order to style
Vertidoslayer follow these steps:- Click on
Vertidoslayer. - Click on the
STYLEtab. - Click on the number 7 next to
FILLand set the marker size toBY VALUE. - Select
volumen_m. Leave the min and max default values. - Click on the color bar and set the
opacityto0.5. - Set the
STROKEto0.
- Click on
You have just created a bubble map! Larger points are “vertidos” with higher “volumen”, and smaller points are “vertidos” with lower “volumen”.
2. Filter rivers by watersheds
2. 1. Connect Rios and Subcuencas layers
- In order to connect these two datasets, we need a common field. In our case,
cod_demar. Then, we need to apply theFilter by layeranalysis. Please, follow these steps:- Back to the main menu, click on
Rioslayer. - Click on
ANALYSIStab. - Click on
ADD NEW ANALYSIS. - Select
Filter by layeranalysis. Click onADD ANALYSIS. - Set the parameters as follow:
FILTER BY LAYER:Subcuencas.SOURCE COLUMN:cod_demar.FILTER COLUMN:cod_demar.
- Click on
APPLY.
- Back to the main menu, click on
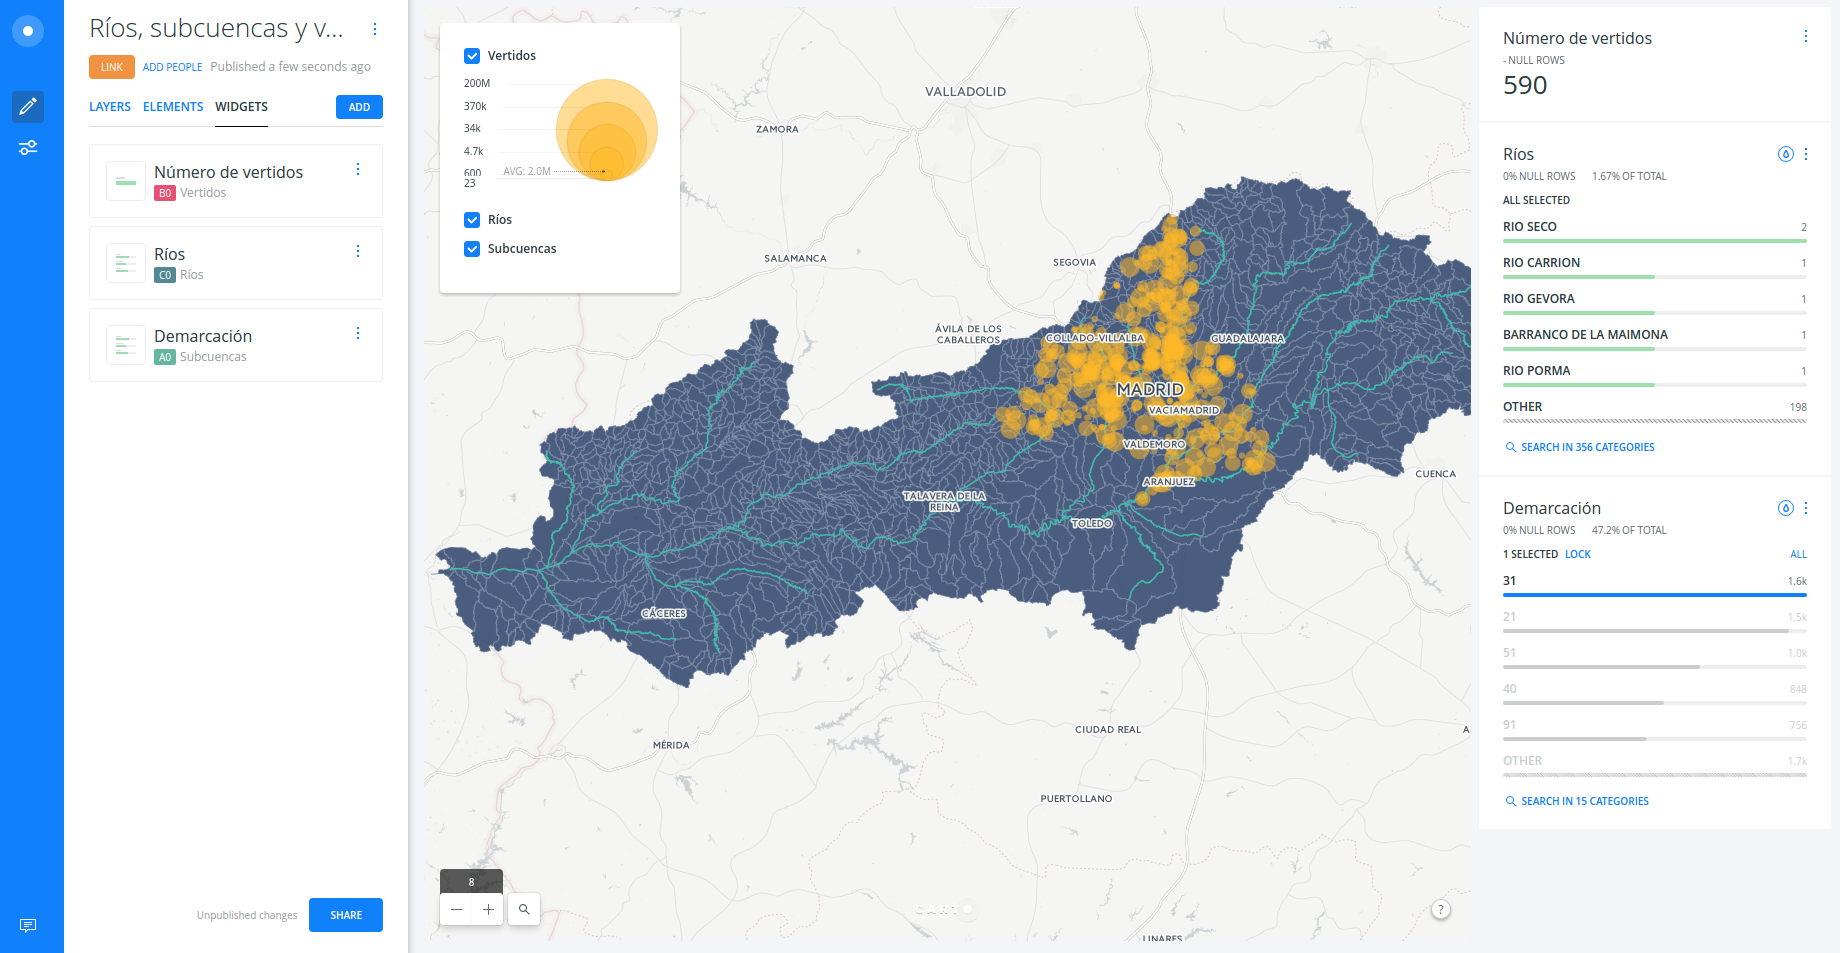
2. 2. Add a widget in order to filter Rios by Subcuencas
- You have both layers connected by the
cod_demar. Now you would only need to add a category widget for filtering by this field:- Back to the main menu, click on
Subcuencaslayer. - Activate the checkbox of
cod_demar. - Click on
EDIT. - Rename the widget as
Demarcación.
- Back to the main menu, click on
- Because we are only interested on the rivers that crosses the Comunidad de Madrid where the “vertidos” are located, we will click on
31value (Tajo river watershed).
3. Intersect Vertidos points with areas of influence from every Rio
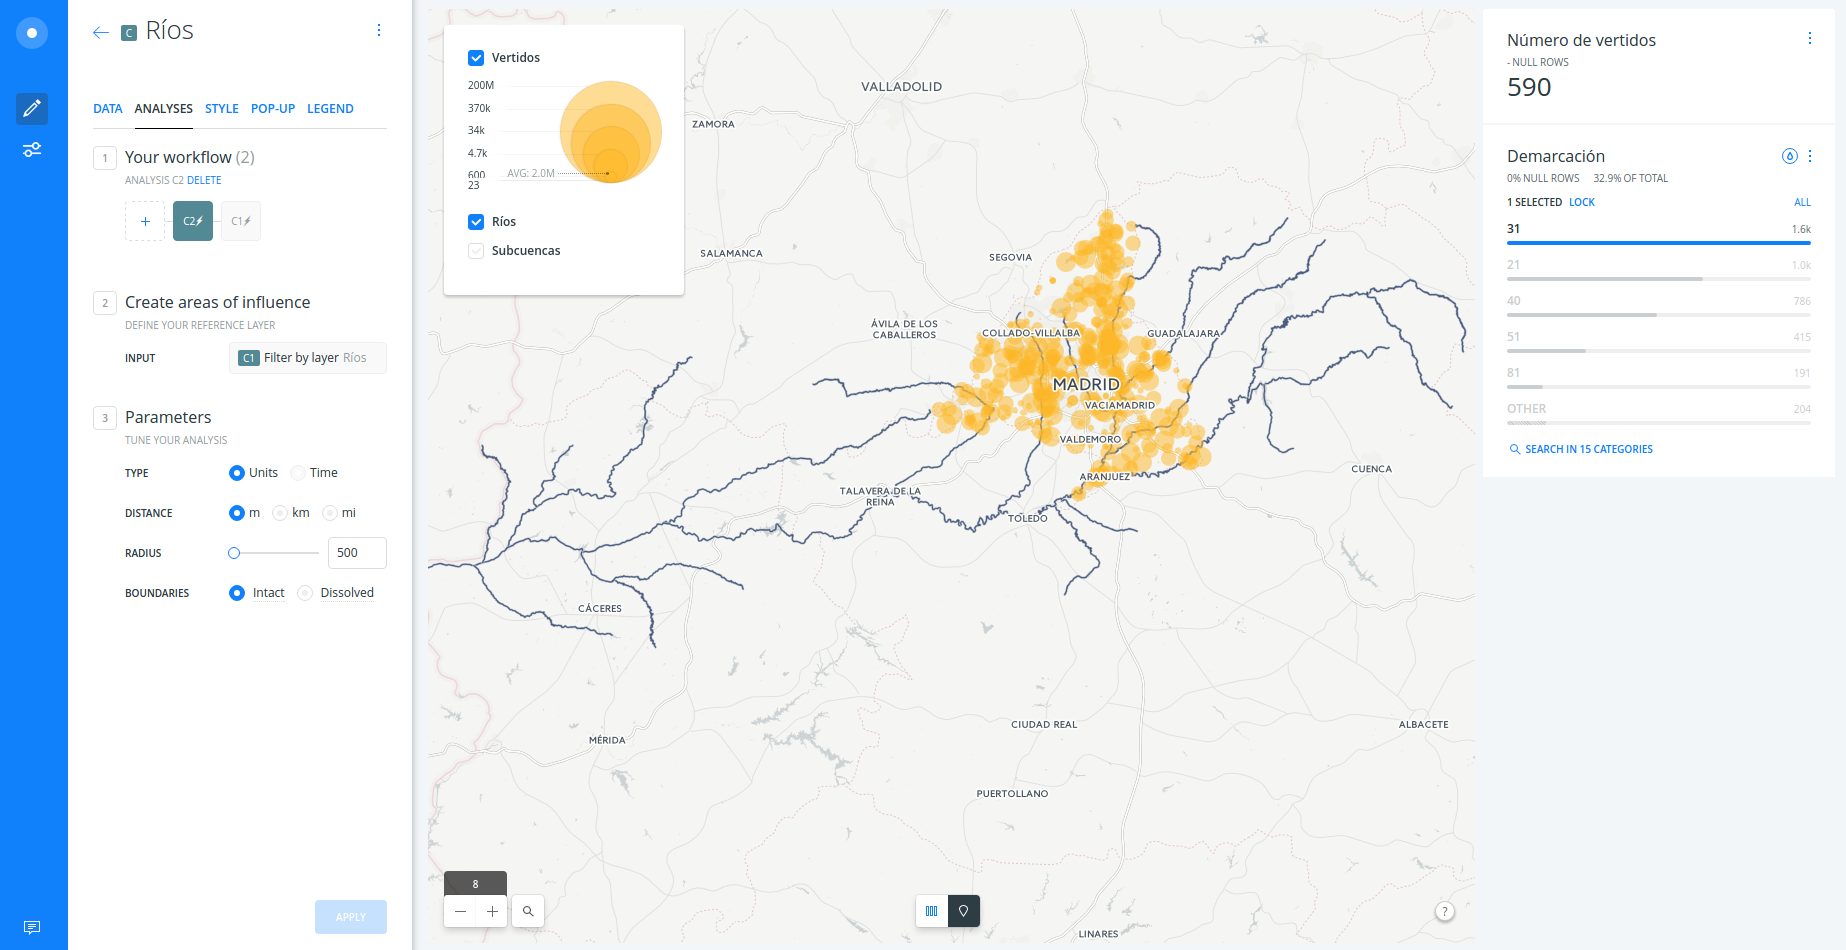
3. 1. Create areas of influences
- Back to the main menu, in order to improve the visualization, disable the view of the
Subcuencaslayer. - Then click on
ADD ANALYSISjust below theRiolayer.- Select
Create areas of influence. Click onADD ANALYSIS. - Set the
RADIUSparameter to500meters. - Click on
APPLY.
- Select
You can check how dynamically the analysis is run by BUILDER changing the
RADIUSparameter.
3. 2. Intersect Vertidos points and get aggregate values
- You do not need to go back to run a new analysis. Just click on the
+sign to concatenate a third and last analysis to theRíoslayer:- Select
Intersect with second layeranalysis. Click onADD ANALYSIS. - Set the parameters as follow:
TARGET LAYER:Subcuencas.OPERATION:SUM(volume_m).
- Click on
APPLY.
- Select
- Go back, to the main menu. Click on
Ríoslayer and check the new columnsum_volume_min the table view.
3. 3. Add an histogram widget to explore volume of Vertidos per Ríos
- Back to the main menu, click on
Ríoslayer.- Activate the checkbox of
sum_volume_m. - Click on
EDIT. - Rename the widget as
Volumen (m3) per river.
- Activate the checkbox of
Could you answer the question?
3. 4. Color Ríos layer by Volumen of Vertido
- Back to the main menu, in order to style
Vertidoslayer follow these steps:- Click on
Ríoslayer. - Click on the
STYLEtab. - Click on the color bar next to
FILLand set the polygon fill toBY VALUE. - Select
sum_volumen_m. - Choose a color palette and set the number of buckets to
5. - Click on the color bar and set the
opacityto0.7. - Set the
STROKEto0.2.
- Click on
- The same intersect analysis can be done to the
Subcuencaslayer:
3. 5. Share your analysis and visualization!
- In order to publish your results, back to the main menu and click on
SHARE. - Click on
PUBLISH(change fromPrivatetoPublicif need). - Copy the link and share it via email, Twitter, LinkedIn or your favorite social network.