QGIS to CARTO BUILDER UPM
- Trainers: Ramiro Aznar · ramiroaznar@carto.com · @ramiroaznar
- November 24th, 2016
http://bit.ly/161124-qgis-builder
Introduction
Prerequisites
- Laptop,
- A modern browser (Google Chrome would be perfect),
- QGIS installed.
Resources
You can take a look on those resources if you want to warm up with CARTO:
- Learn guides.
- BUILDER Documentation & FAQs.
New Featuresblog posts.- QGIS Plugin website & repo.
- Other online resources.
Support
- Email to support@carto.com.
- Some questions could be already anwered at GIS Stack Exchange
cartotag.
Contents
1. QGIS to CARTO
1.1. Setting up
- The instructors will provide you a user and passwor to access your account
- Log into your
upm-cartoXXaccount going tohttps://carto.com/login
1.2. QGIS Plugin installation
- Open QGIS
- From the
Pluginsmenu ->Manage and Install Plugins - Type “CartoDB Plugin”.
- Click
Install Plugin.
1.3. Connect your CARTO account to QGIS
- From the CartoDB toolbox (located on the QGIS Web Toolbar) or from the Layers Toolbar in QGIS, Click
Add Connection. - Select
Newfrom the Connection Manager. - Go back to CARTO dashboard.
- Go to your account options (at the top right corner) and copy your API Key.
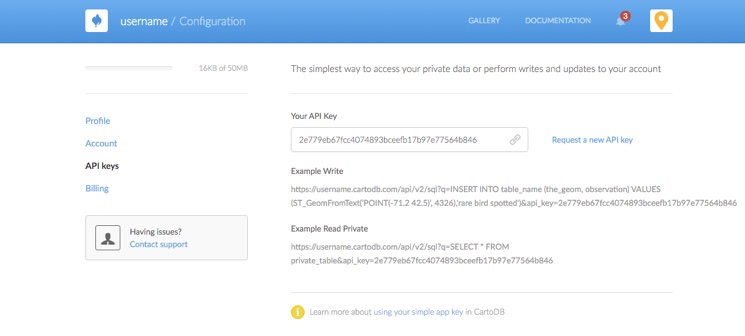
- Enter your CARTO account settings: user name and API Key.
- Click
Save.
*Note: a more detailed guide can be found here.
1.4. Import CARTO layers
- Go back to CARTO dashboard.
- Click on
DATASETS(at the top left corner). - Click on
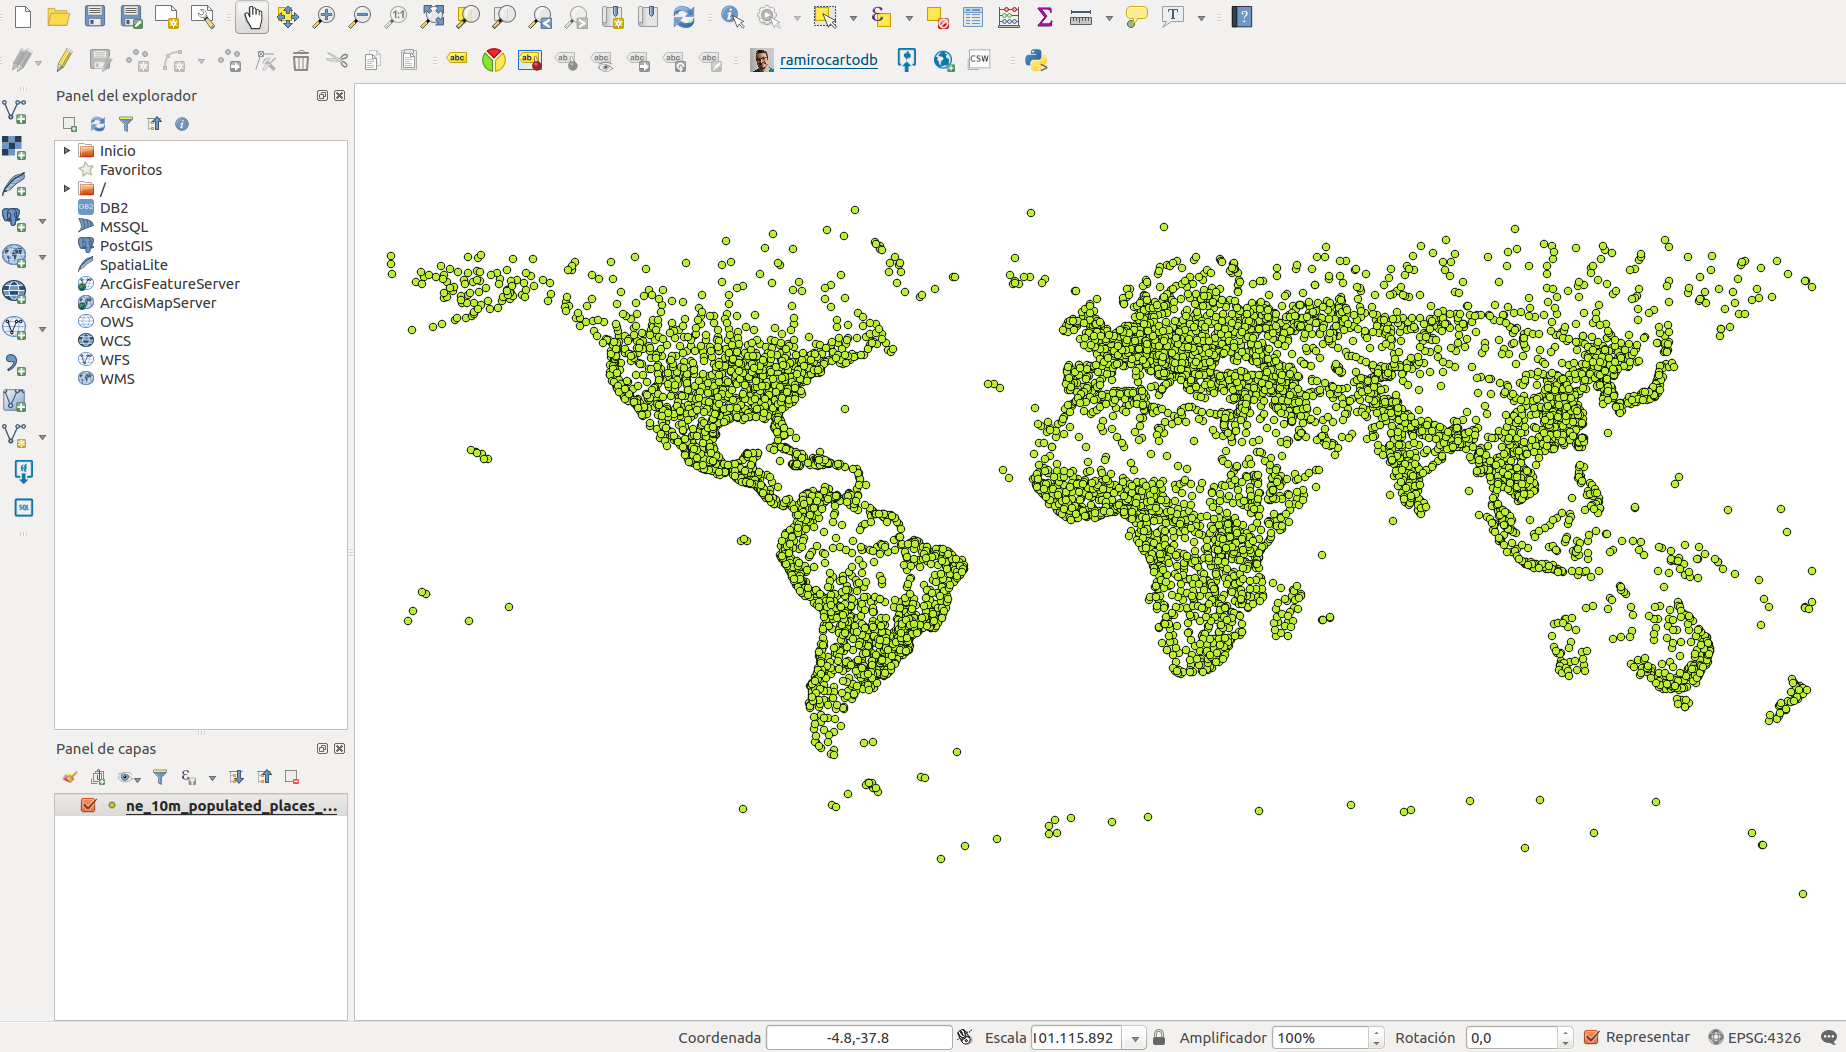
DATA LIBRARYand search for “populated places” dataset. - Select
ne_10m_populated_places_simpleand click onCONNECT DATASET. - Go back to QGIS.
- From the CartoDB toolbox, click
Add CartoDB Layer. - Select
ne_10m_populated_places_simpledataset from the list, or search for a table name to filter the list, and clickOK.
*Note: a more detailed guide can be found here.
1.5. Create a map
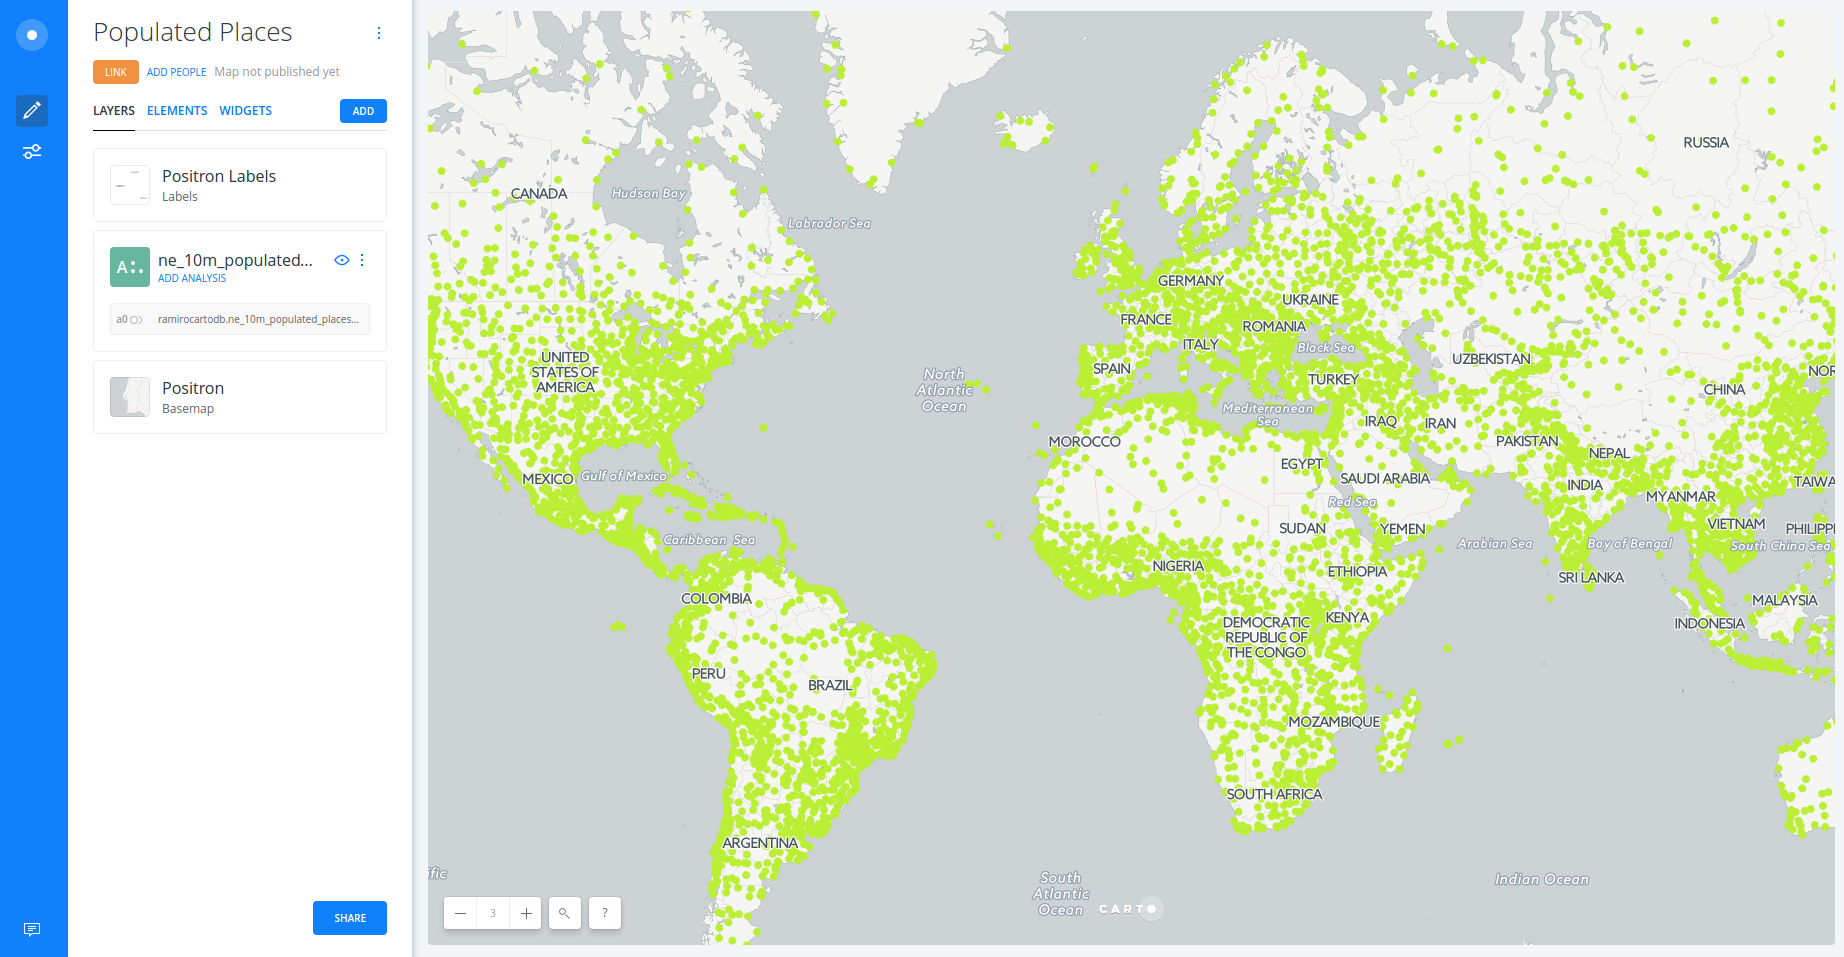
- After working with QGIS, you can export your layers into CARTO or create a map.
- From the CartoDB toolbox, click
Create New Map. - Type the title and description for your map.
- Click on
Create. - Go back to CARTO dashboard.
- Click on
MAPS(at the top left corner). - Open the new map you have just created.
*Note: a more detailed guide can be found here.
2. Getting started with BUILDER
2.1. Layers
- You can rename the title of this new layer as “Cities”.
- Click on the layer to show its components:
DATAANALYSISSTYLEPOP-UPLEGEND
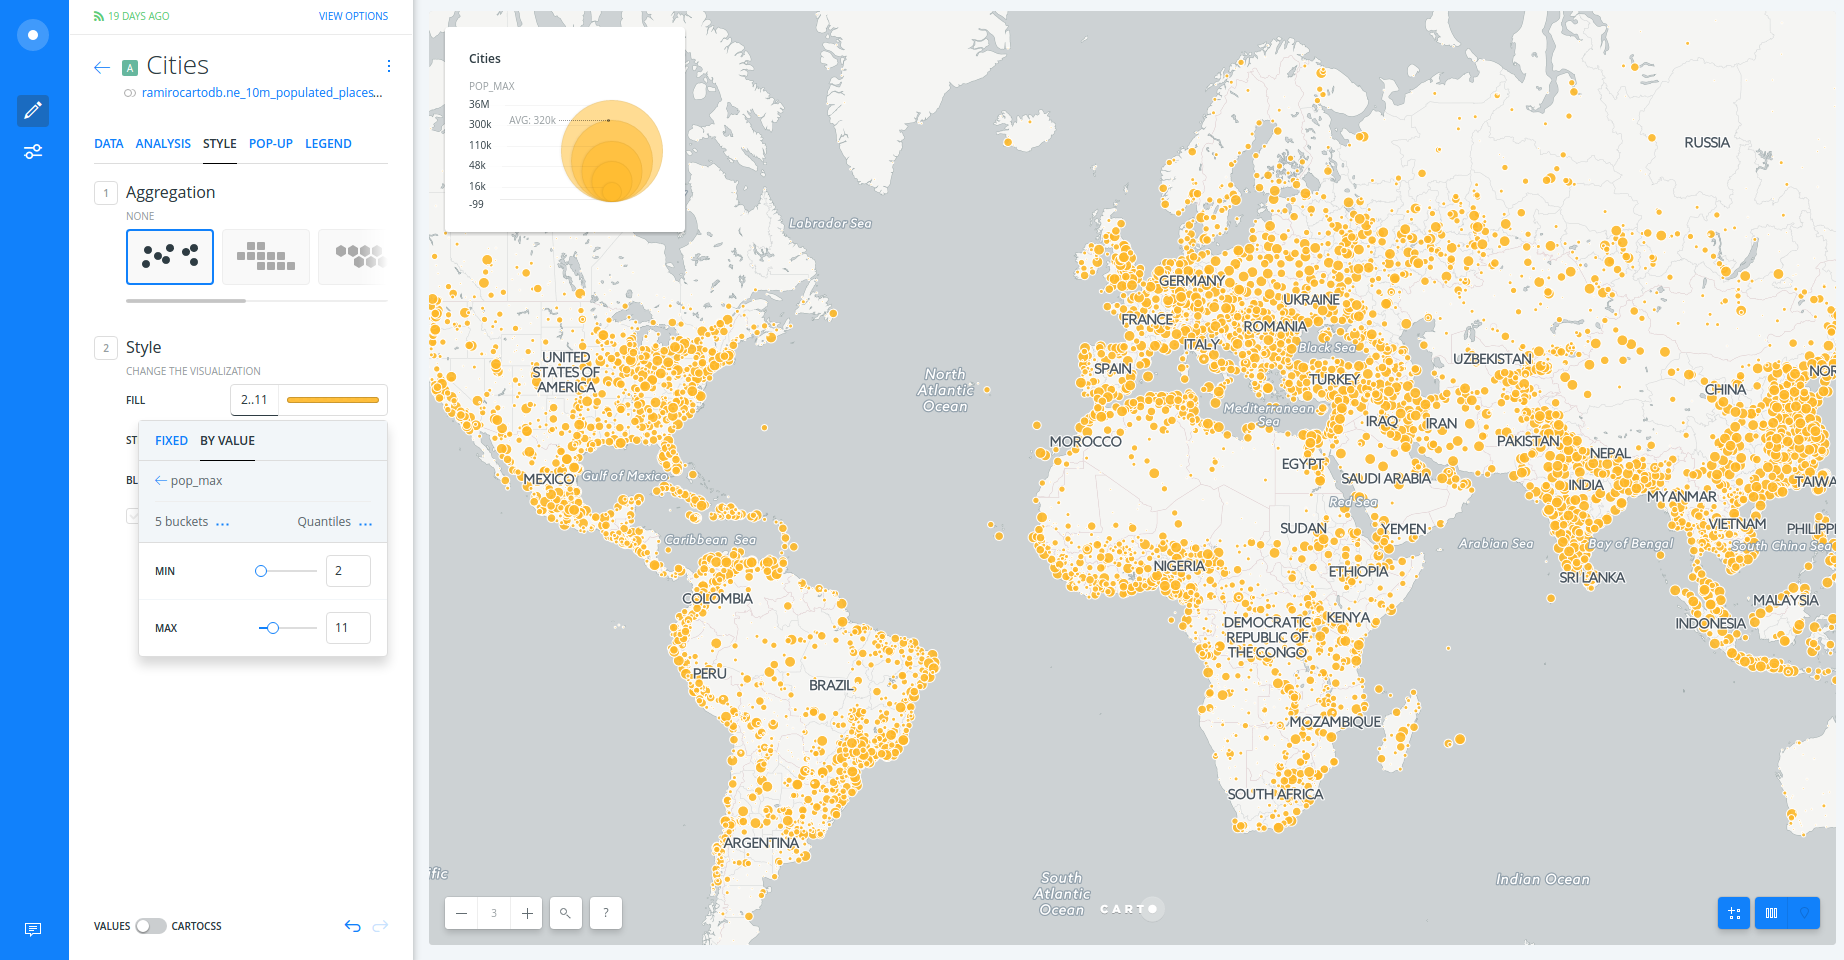
2.2. Styling
- Create a bubble (proportional symbols) map:
- Click on
STYLE. - Click on point-size number.
- Select
BY VALUE. - Select
pop_maxcolumn.
- Click on
- Create a chroropleth map:
- Click on
marker-fillcolumn. - Select
BY VALUE. - Select
pop_maxcolumn (a better cartographic practice would be selecting a normalized field). - You can customize your map further changing (and flipping) a different color palette, the number of buckets and quantification method.
- Click on
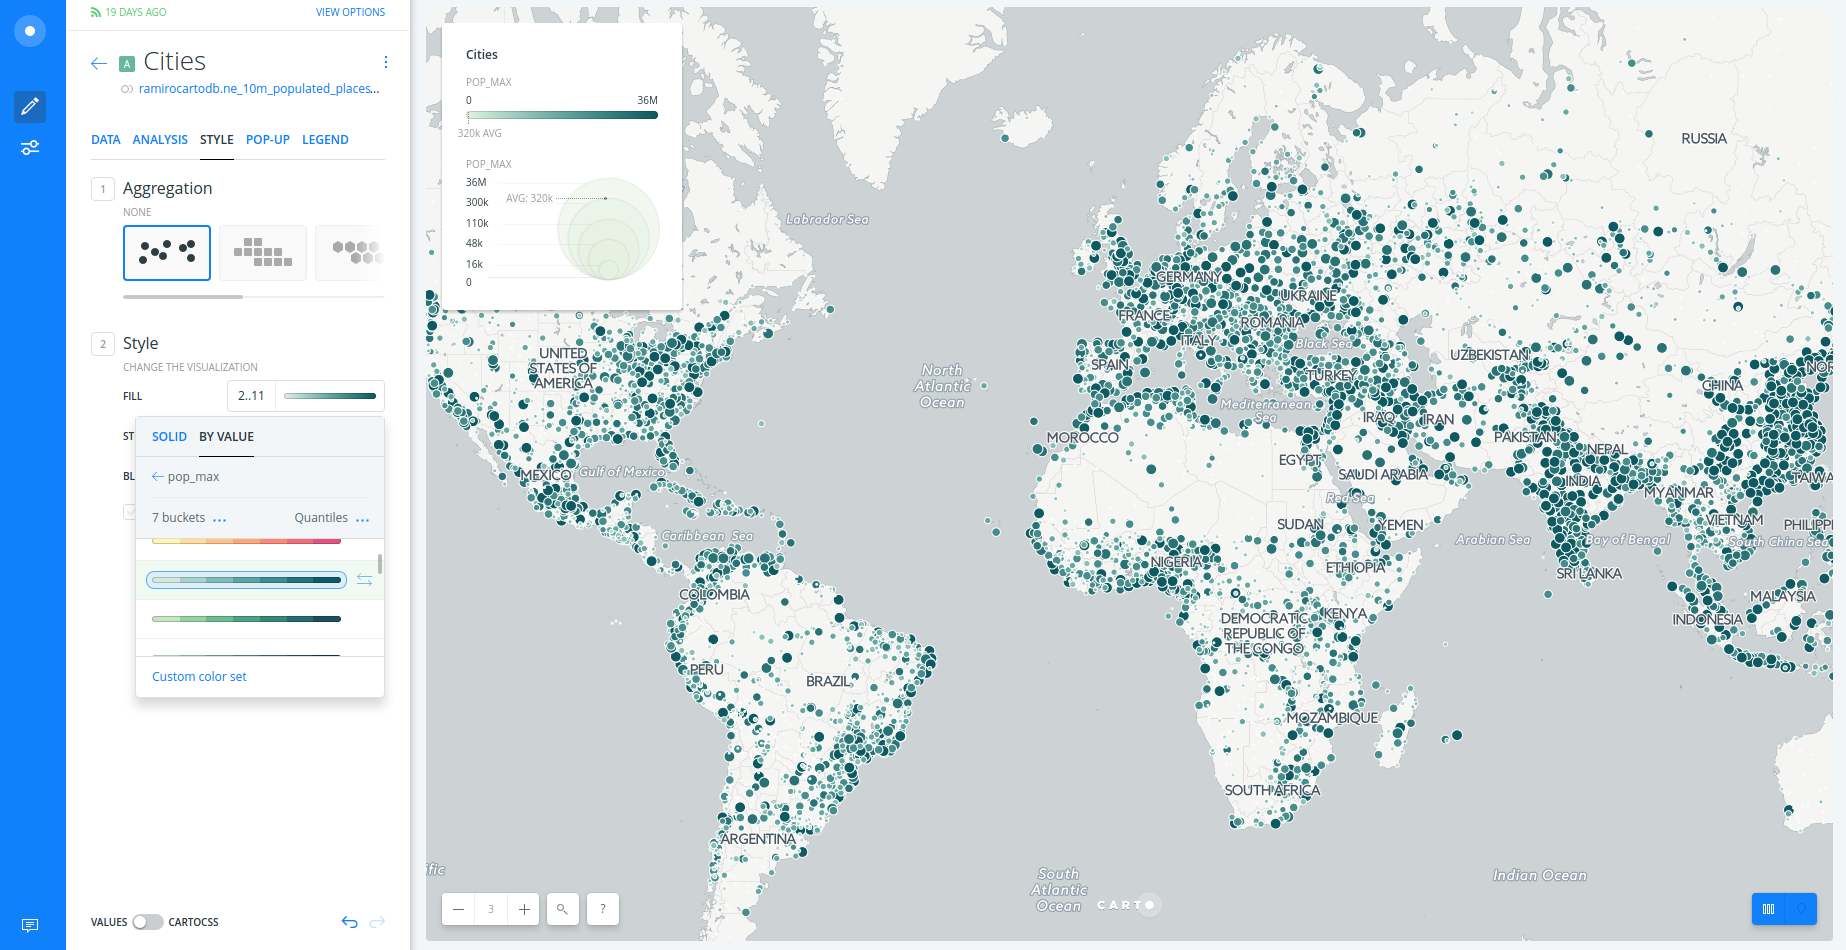
*To learn more about how this works behind the scenes check out the CartoCSS panel.
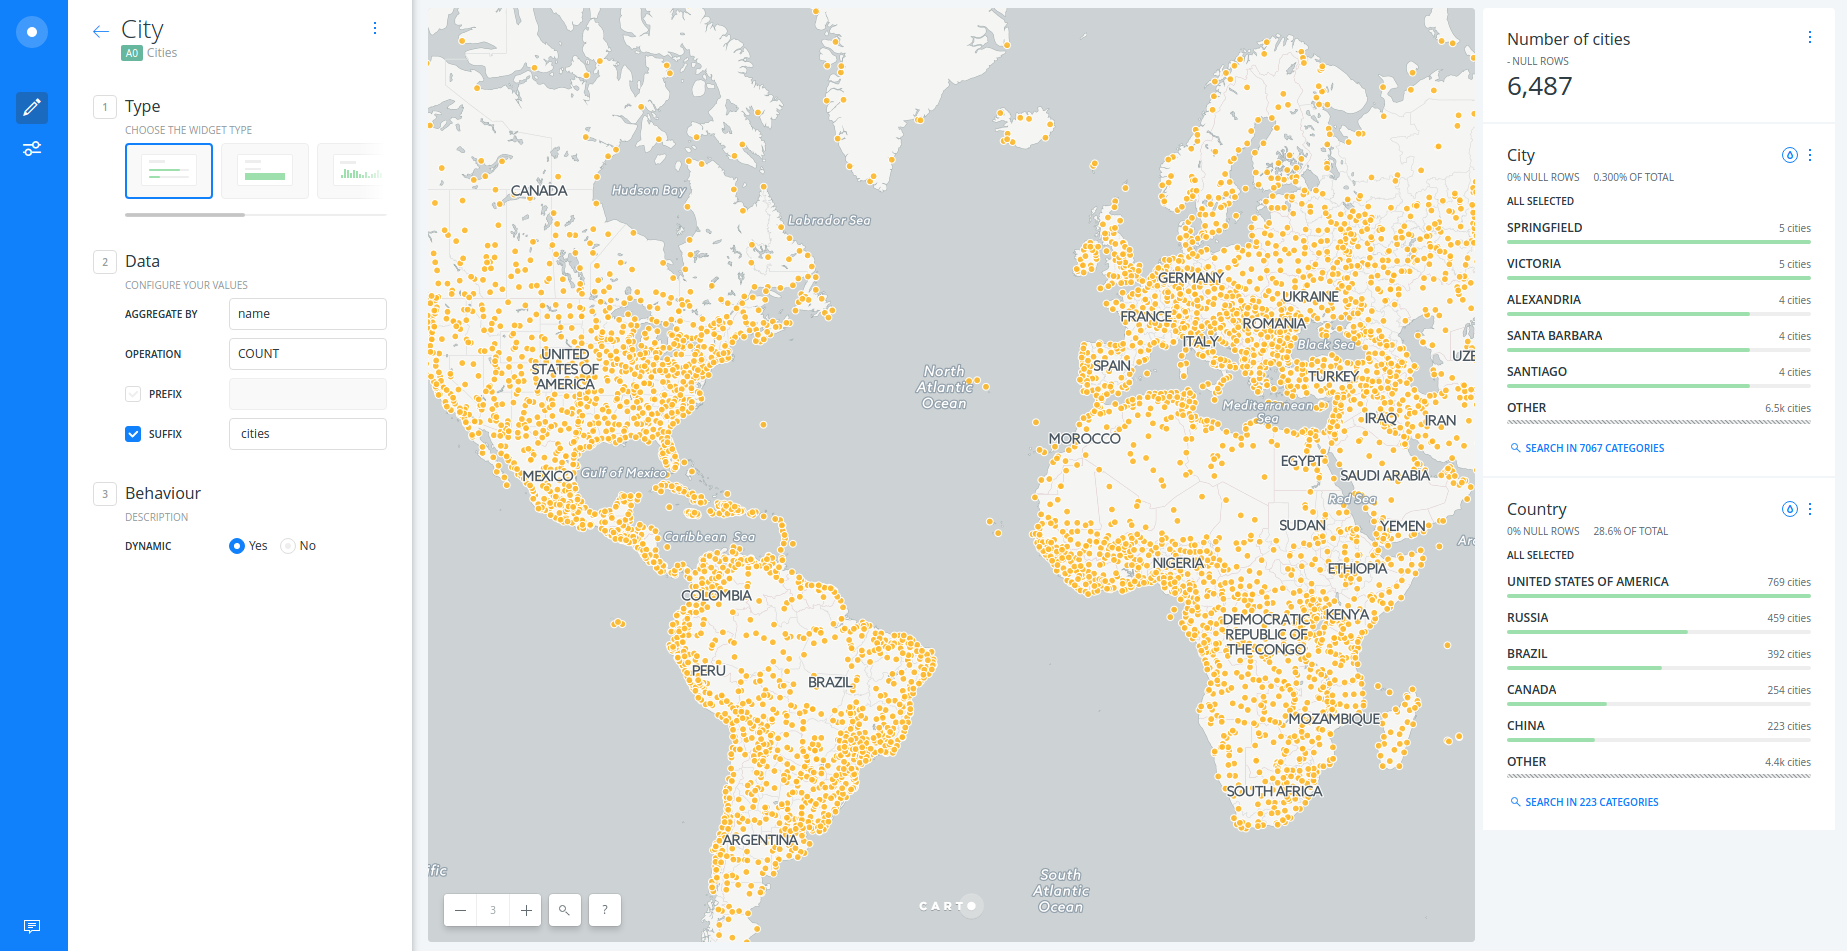
2.3. Widgets
- Set styles as default (orange dots).
- Go back to the main menu.
- Click on the layer.
- Add widgets to “Cities” layer:
- Click on
DATA. - Select
point countin order to show the number of cities. - Select
namein order to filter by city name. - Select
adm0namein order to filter by country name. - Click on
EDITin order to customize these widgets.
- Click on
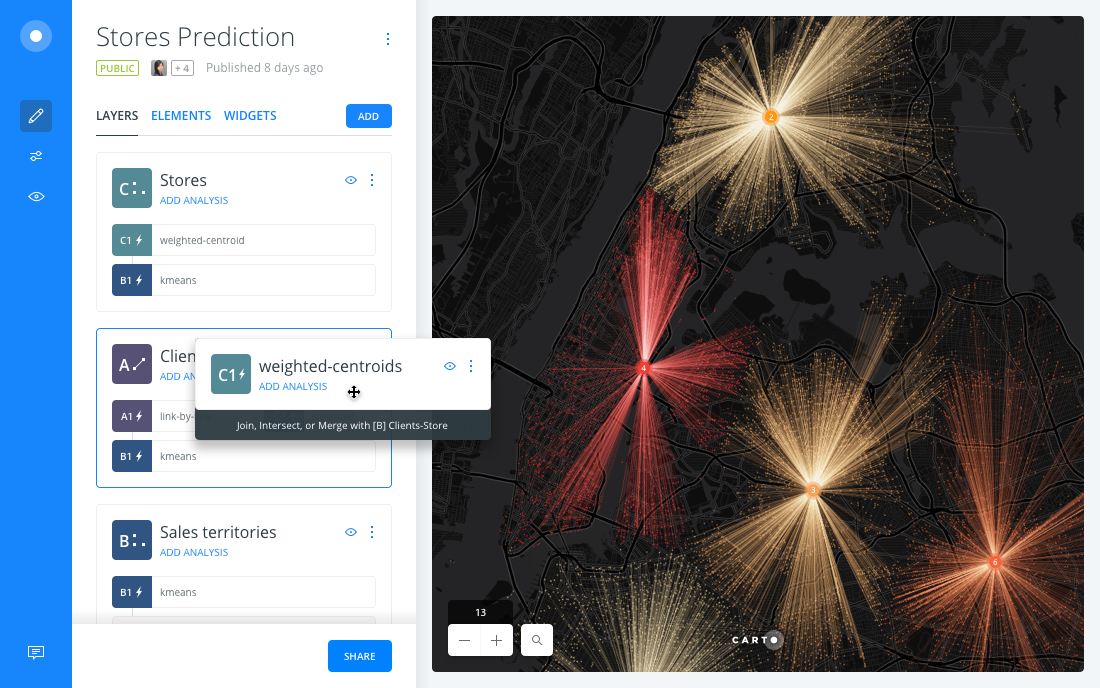
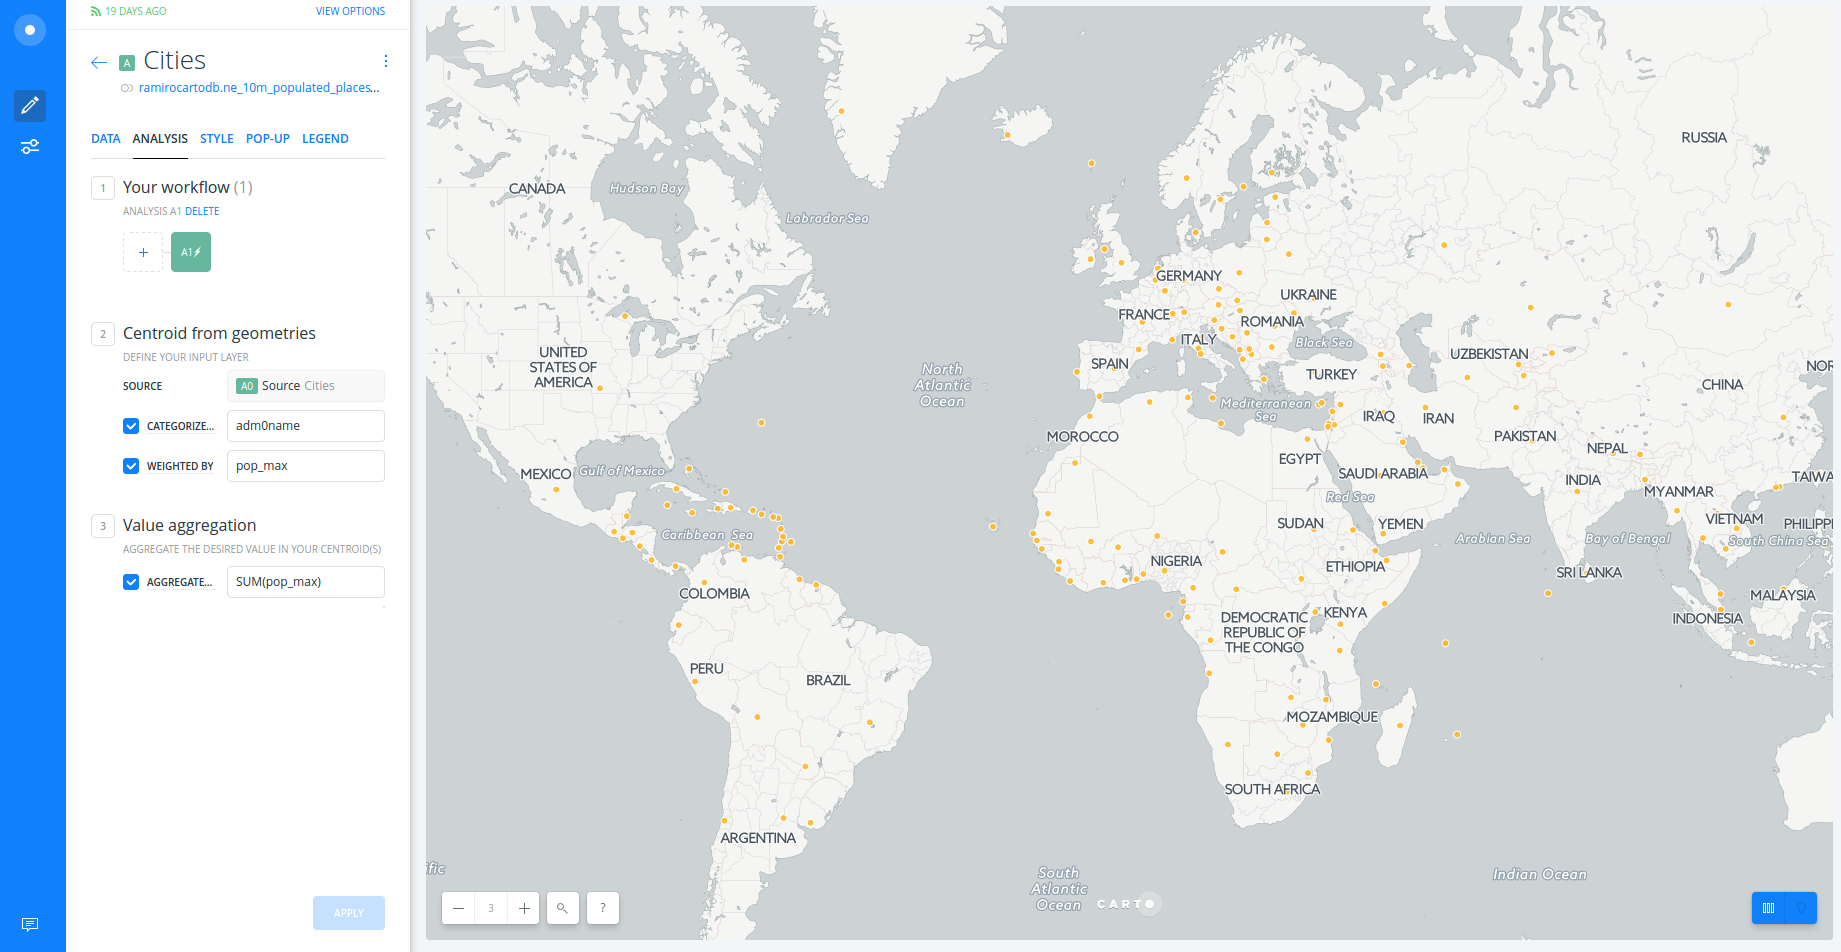
2.4. Analysis
Centroids
- Go back to the main menu.
- Click on
LAYERS. - Click on
ADD ANALYSISbelow “Cities” layer. - Select “Find centroid of geometries” analysis.
- Click on
ADD ANALYSIS. - Set paramaters as follows:
CATEGORIZE...:adm0name.WEIGHTED BY:pop_max.AGGREGATE...:SUM(pop_max).
Connect with lines
- Go back to the main menu.
- Drag and drop out the source layer node.
- Rename
Anode as “Centroids”. - Click on
ADD ANALYSISbelow “Cities” layer. - Select “Connect with lines” analysis.
- Click on
ADD ANALYSIS. - Set paramaters as follows:
TYPE:To Source.TARGET:A1 Centroids.CLOSEST:All to all.GROUP BY:SOURCE COL.:adm0name.TARGET COL.:category.
- Click on
APPLY.
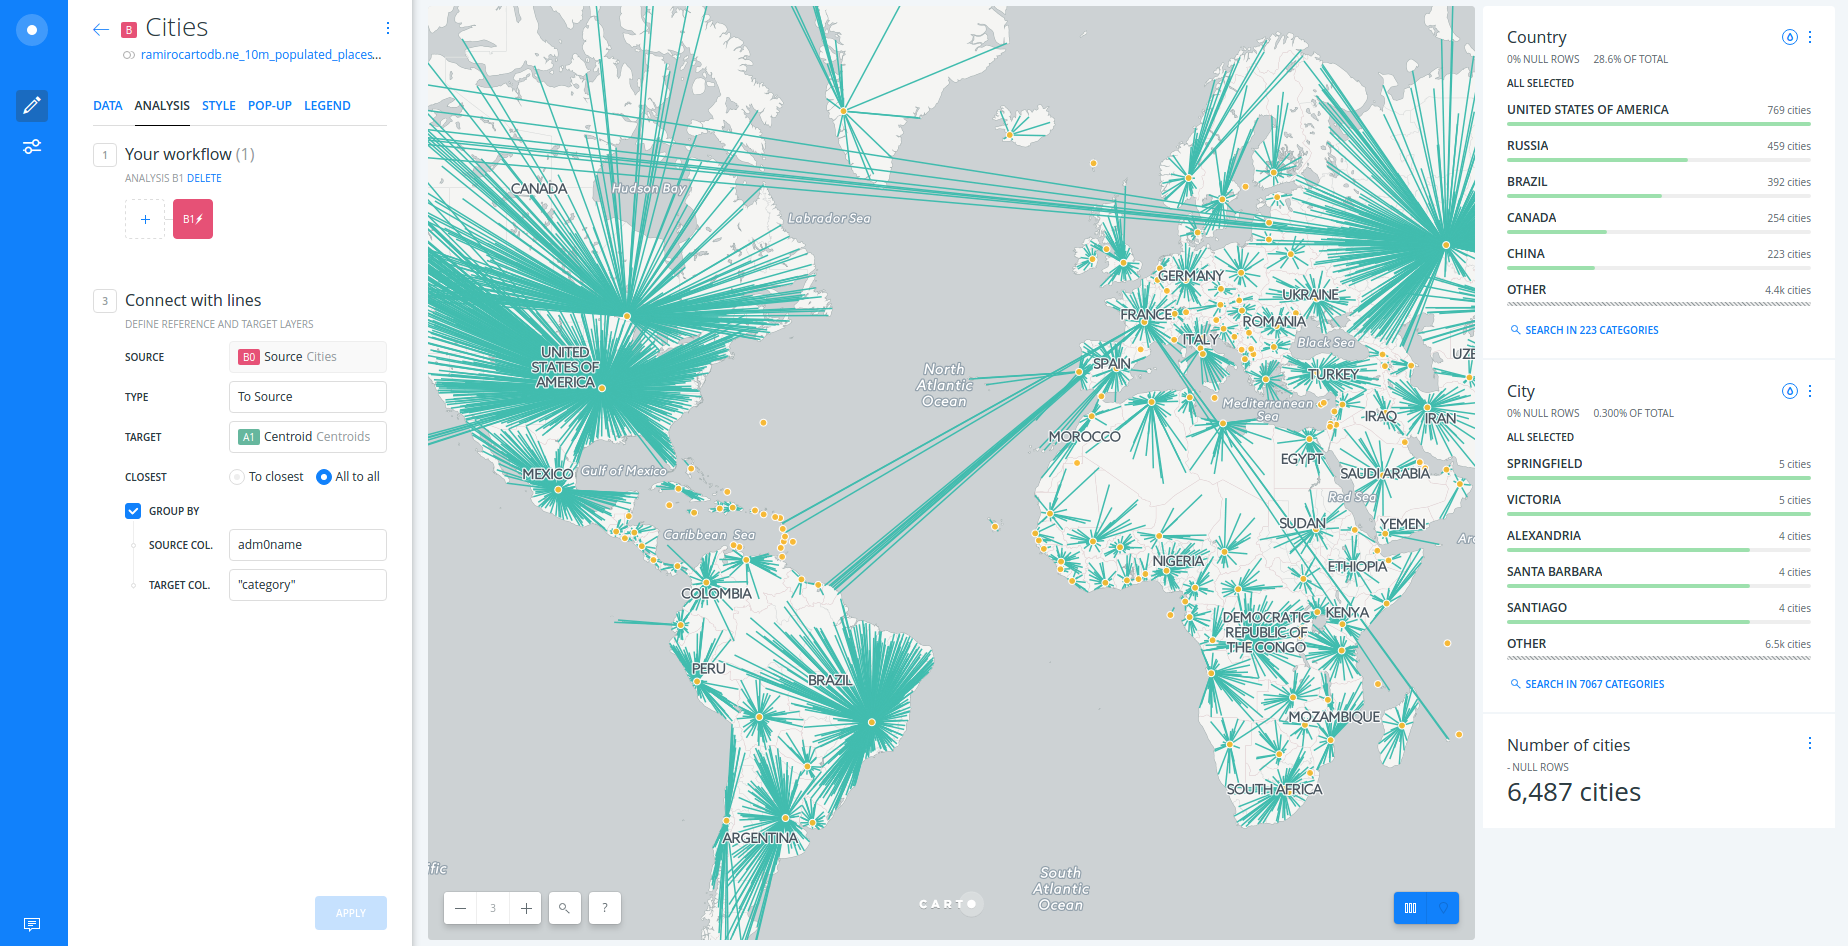
- Finally, edit centroid dots based upon
valueand lines based uponpop_max.
*Note: to learn more about connect with lines analysis have a look at this guide and blogpost.
2.5. Publish
- Click on
SHARE. - Set to
LINKorPUBLIC. - Click on
PUBLISH. - Now you can share the map as link or embed.