Spatial Data Analysis with Policy Data SIPA analysis of data from OpenNepal.net
Spatial Data Analysis with Policy Data
Andy Eschbacher, Map Scientist, CartoDB
Workshop, February 3rd, 2015, School of International and Policy Affairs, Columbia University
Find this document here: http://bit.ly/cdb-sipa (Source code)

Data Import
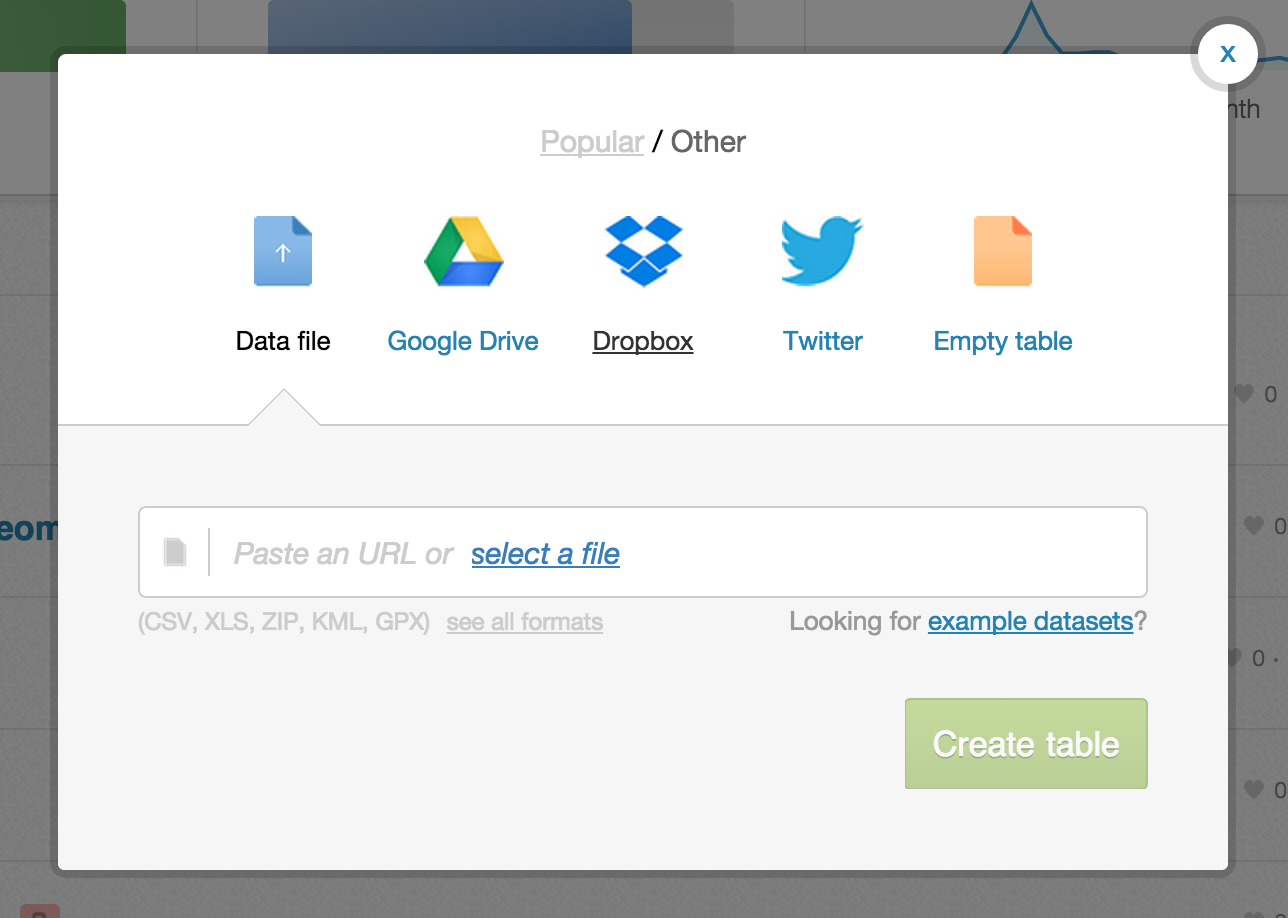
To make sure we’re all on the same page, let’s import these two files into your CartoDB account.
Nepal District Polygons
http://andye.cartodb.com/api/v2/sql?q=SELECT%20*%20FROM%20nepal_districts2&filename=nepal_districts2&format=geojson
Number of Schools in Nepal (2007-2011)
http://andye.cartodb.com/api/v2/sql?q=SELECT%20*%20FROM%20number_of_schools_in_nepal&filename=number_of_schools_in_nepal&format=geojson
To import, copy the URL and paste it into the Import Box in your CartoDB account. Don’t worry about downloading–it’s more efficient to just import directly through the URL. Like the Himalayas, we’re in the cloud!
SQL – structured query language
CartoDB is a tool for geospatial data manipulation and visualization.
SQL is a language for data manipulation. It has the power to manipulate geospatial data.
SQL is a language that’s easy to learn and get a lot of power from. It might seems strange at the beginning, but once you get a handle on a couple of basic features you’ll do amazing things with your data analysis. Yes, SQL connects strongly with mapping!
Basic Syntax
The most basic statement is:
SELECT * FROM table_name
The * means everything. This means that all rows and columns from the table are given back once the query is run.
A more detailed query is like this:
SELECT
  name,
  height,
  age
FROM
  class_list
WHERE
  name = 'Andy'
  AND (
    height > 1.8
    OR
    height < 1.6
  )
SELECTis what you’re requesting (required)FROMis where the data is located (required)WHEREis the filter on the data you’re requesting (optional)
As a sentence it reads, Select the name, height, and age from a data table where the name is Andy and the height is greater than 1.8 meters or less than 1.6 meters.
You can optionally add LIMIT n (where n is an integer >= 0), which gives you only n entries, and ORDER BY column_name ASC, which sorts in ascending order (DESC is another option). You can combine them to give you the top 20 largest districts by number of schools.
SELECT
  district,
  year,
  number_of_schools
FROM
  number_of_schools_in_nepal
ORDER BY
  number_of_schools
LIMIT
  20
the_geom, the_geom_webmercator, and cartodb_id
There are two special columns in CartoDB:
the_geomthe_geom_webmercator
The first of these is in the units of standard latitude/longitude, while the second is a projection based on the original Mercator projection but optimized for the web.
If you want to run on-the-fly SQL commands and see your map update, make sure to SELECT the the_geom_webmercator because this is the column that’s used for mapping–the other is more of a convenience column since most datasets use lat/long.
If you want to enable interaction on your maps (click events, hover boxes, etc.), you also need to SELECT the column called cartodb_id.
For instance, the following statement will produce a map with click features:
SELECT
  the_geom_webmercator,
  district,
  cartodb_id
FROM
  nepal_districts2
Available functions
Once you become accustomed to the syntax, the sky will seem like the limit when processing data in this way.
Several are aggregate functions, meaning that they need to be grouped by a certain column.
Find the average of the number of schools over all years grouped by district:
SELECT
  avg(number_of_schools) AS avg_num_schools,
  district
FROM
  number_of_schools_in_nepal
GROUP BY
  district
Let’s create a table from this query. To do so, click on the “create table from query” text. Rename your table to avg_num_schools_nepal.
Now take a look at the_geom column – it’s empty. We need to find a way to get the geospatial stuff.
Powerful ways of combining two data sets – JOIN
We’re working with the Nepal data, but we want to visualize it on a map. Not all of the data has explicit geographical information, so we need to find a way to get it.
Oftentimes you want pieces from two different datasets but there’s not an obvious way of combining it in a sound way.
Let’s look at two of our datasets: avg_num_schools_nepal and nepal_districts2.
We could try using a geocoding service that gives us polygons based on place names, but accuracy is often a problem, especially for developing countries.
What we can instead do is combine the needed parts from two different data sets into a new data set that’s perfect for our use.
nepal_districts2has the geospatial componentavg_num_schools_nepalhas the information about schools that we need
SELECT
  nd.the_geom_webmercator,
  nd.population,
  ansn.district,
  ansn.avg_num_schools,
  ansn.avg_num_schools * 1000 / nd.population AS schools_per_thousand,
  ansn.cartodb_id
FROM
  nepal_districts2 AS nd,
  avg_num_schools_nepal AS ansn
WHERE
  ansn.district = nd.district
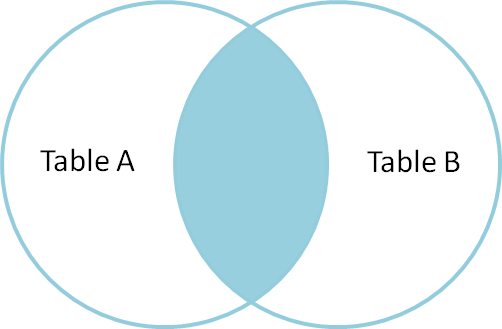
This is called a JOIN. It’s written more formally as:
SELECT
  nd.the_geom_webmercator,
  nd.population,
  ansn.district,
  ansn.avg_num_schools,
  ansn.avg_num_schools * 1000 / nd.population AS schools_per_thousand,
  ansn.cartodb_id
FROM
  nepal_districts2 AS nd
JOIN
  avg_num_schools_nepal AS ansn
ON
  ansn.district = nd.district
We can represent this as a Venn Diagram (images and inspiration from this excellent blog post):
If we check out our map, though, we’ll see some districts are missing! These must represent places where no data was taken since there is not a value that corresponds to them in the school data set.
What we want instead is a JOIN that keeps all of the district polygons and leaves the school number information empty–that is, lacking a value (null value).
We can visualize this with a LEFT JOIN. The left is the Nepal district polygons, and the right is the schools data.
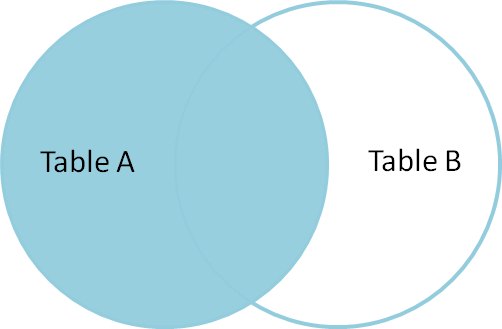
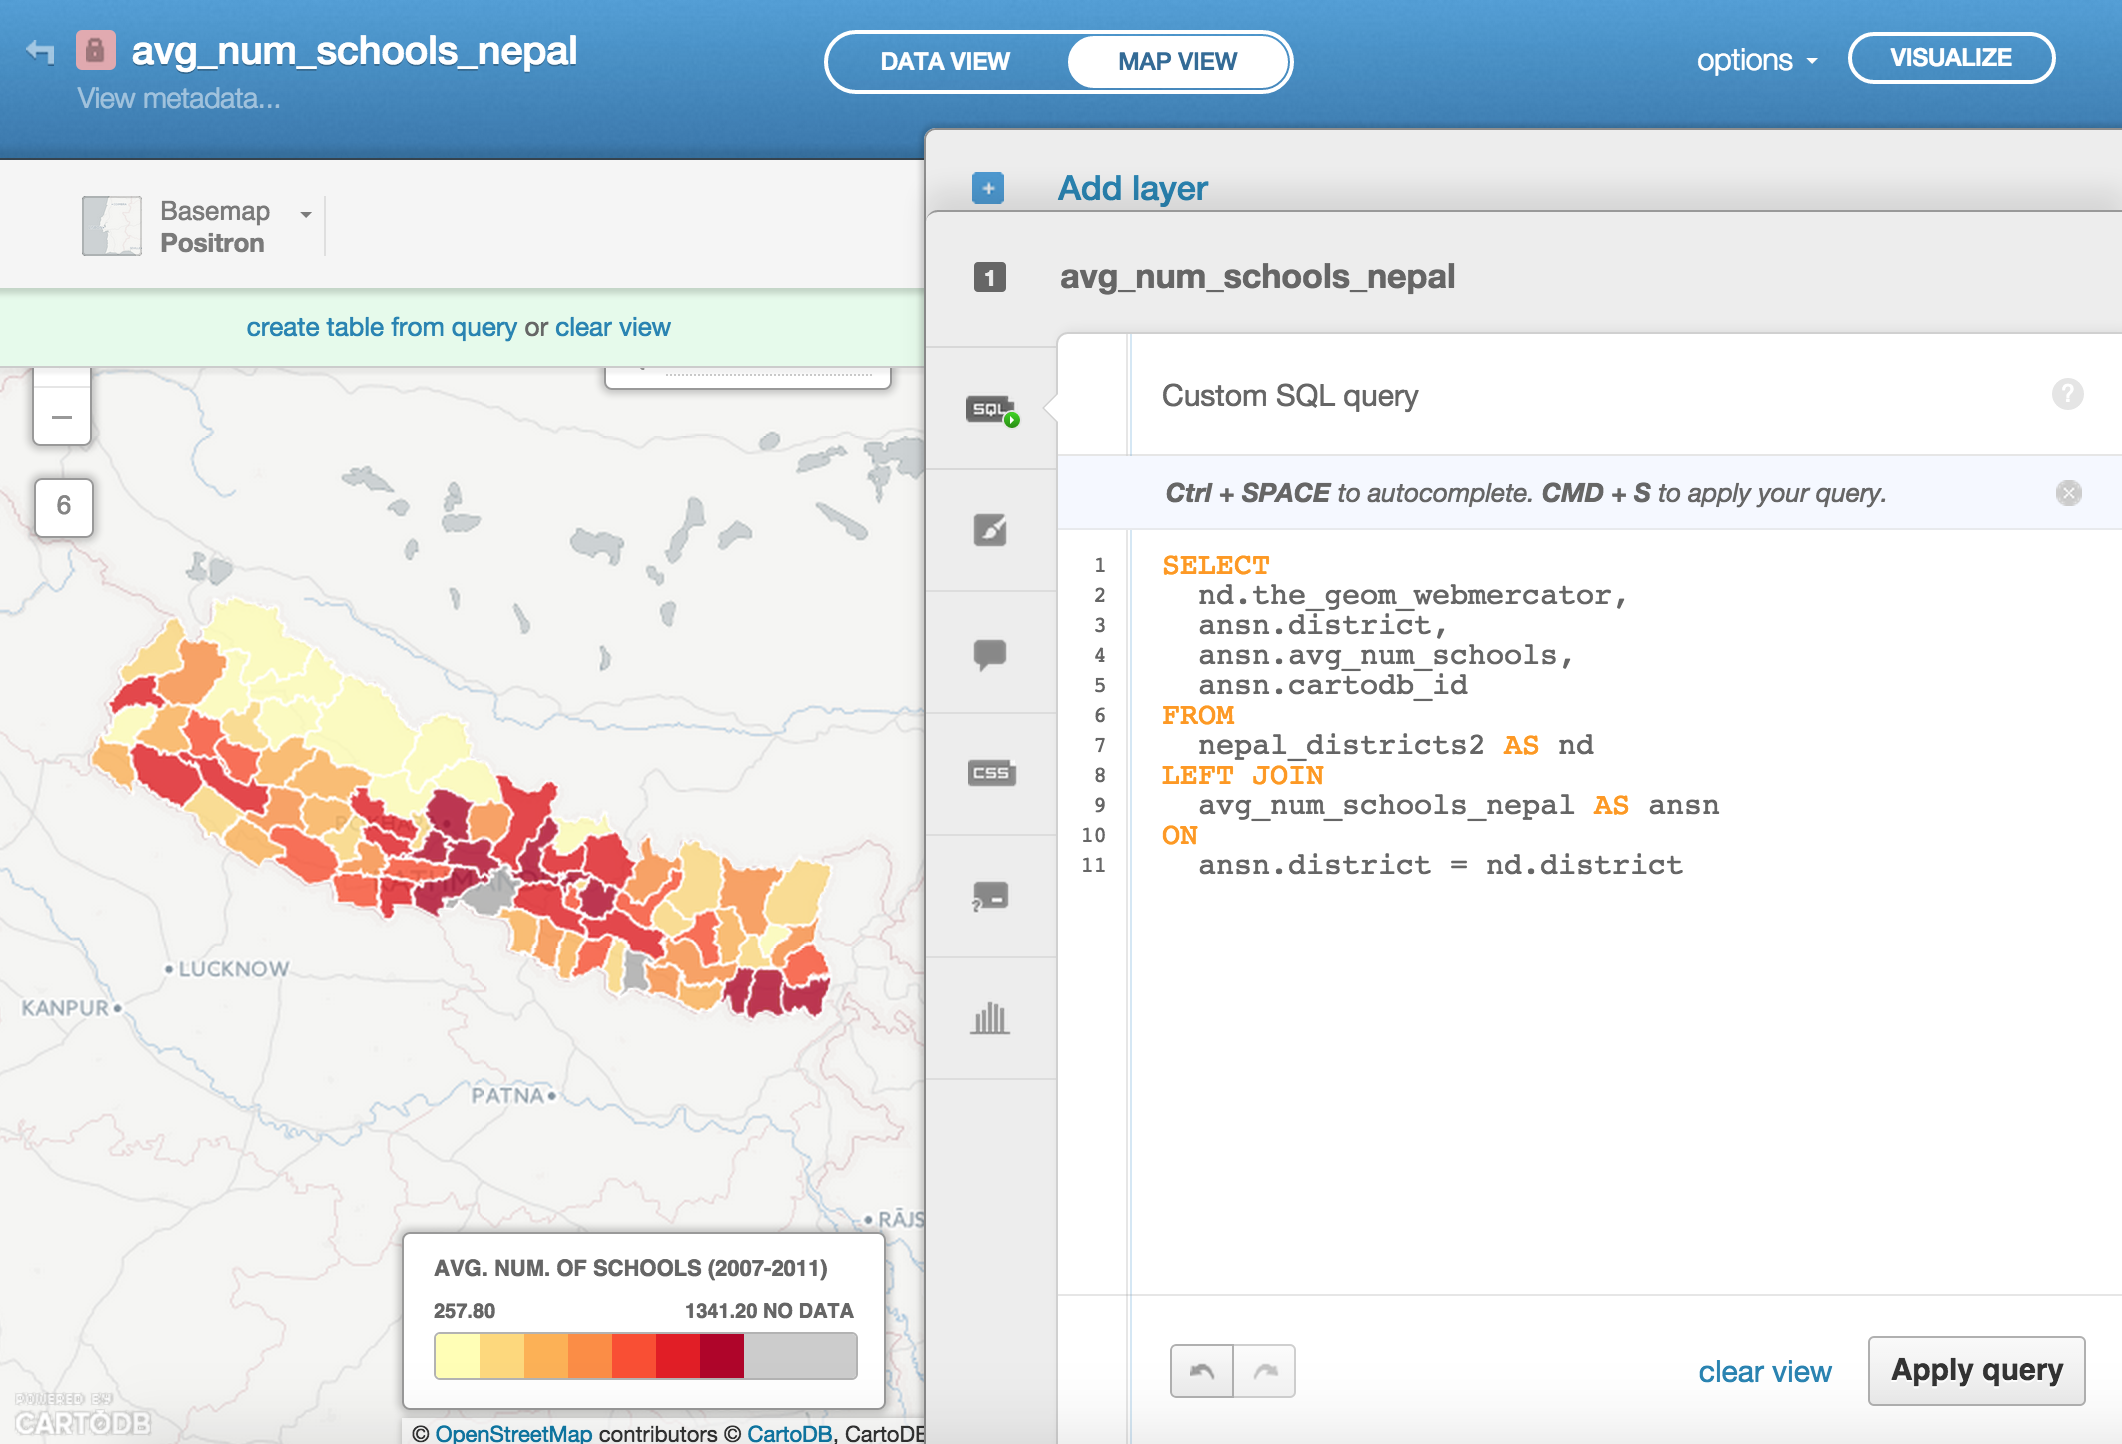
All we need to do is update our statement below with a LEFT keyword before JOIN.
SELECT
  nd.the_geom_webmercator,
  nd.population,
  ansn.district,
  ansn.avg_num_schools,
  ansn.avg_num_schools * 1000 / nd.population AS schools_per_thousand,
  ansn.cartodb_id
FROM
  nepal_districts2 AS nd
LEFT JOIN
  avg_num_schools_nepal AS ansn
ON
  ansn.district = nd.district
Run this statement in your SQL editor and now look at your map. All the district polygons should be present.
Now choose Choropleth to get your map styled as you like it.
Here’s the CartoCSS that I used to style my map:
/** choropleth visualization */

#avg_num_schools_nepal{
  polygon-fill: #FFFFB2;
  polygon-opacity: 0.8;
  line-color: #FFF;
  line-width: 1;
  line-opacity: 1;
}
#avg_num_schools_nepal [ schools_per_thousand <= 5.973241260250323] {
   polygon-fill: #B10026;
}
#avg_num_schools_nepal [ schools_per_thousand <= 2.494266917858927] {
   polygon-fill: #E31A1C;
}
#avg_num_schools_nepal [ schools_per_thousand <= 2.176494796872244] {
   polygon-fill: #FC4E2A;
}
#avg_num_schools_nepal [ schools_per_thousand <= 1.886766693516458] {
   polygon-fill: #FD8D3C;
}
#avg_num_schools_nepal [ schools_per_thousand <= 1.7310002460451854] {
   polygon-fill: #FEB24C;
}
#avg_num_schools_nepal [ schools_per_thousand <= 1.3209913257953088] {
   polygon-fill: #FED976;
}
#avg_num_schools_nepal [ schools_per_thousand <= 0.7697060825330803] {
   polygon-fill: #FFFFB2;
}
#avg_num_schools_nepal [ schools_per_thousand = null] {
   polygon-fill: #AAAAAA;
}
PostGIS – geospatial analysis in a database
Using the npl_admn4 shapefile:
http://andye.cartodb.com/api/v2/sql?q=SELECT%20*%20FROM%20npl_adm4&filename=npl_adm4&format=shp
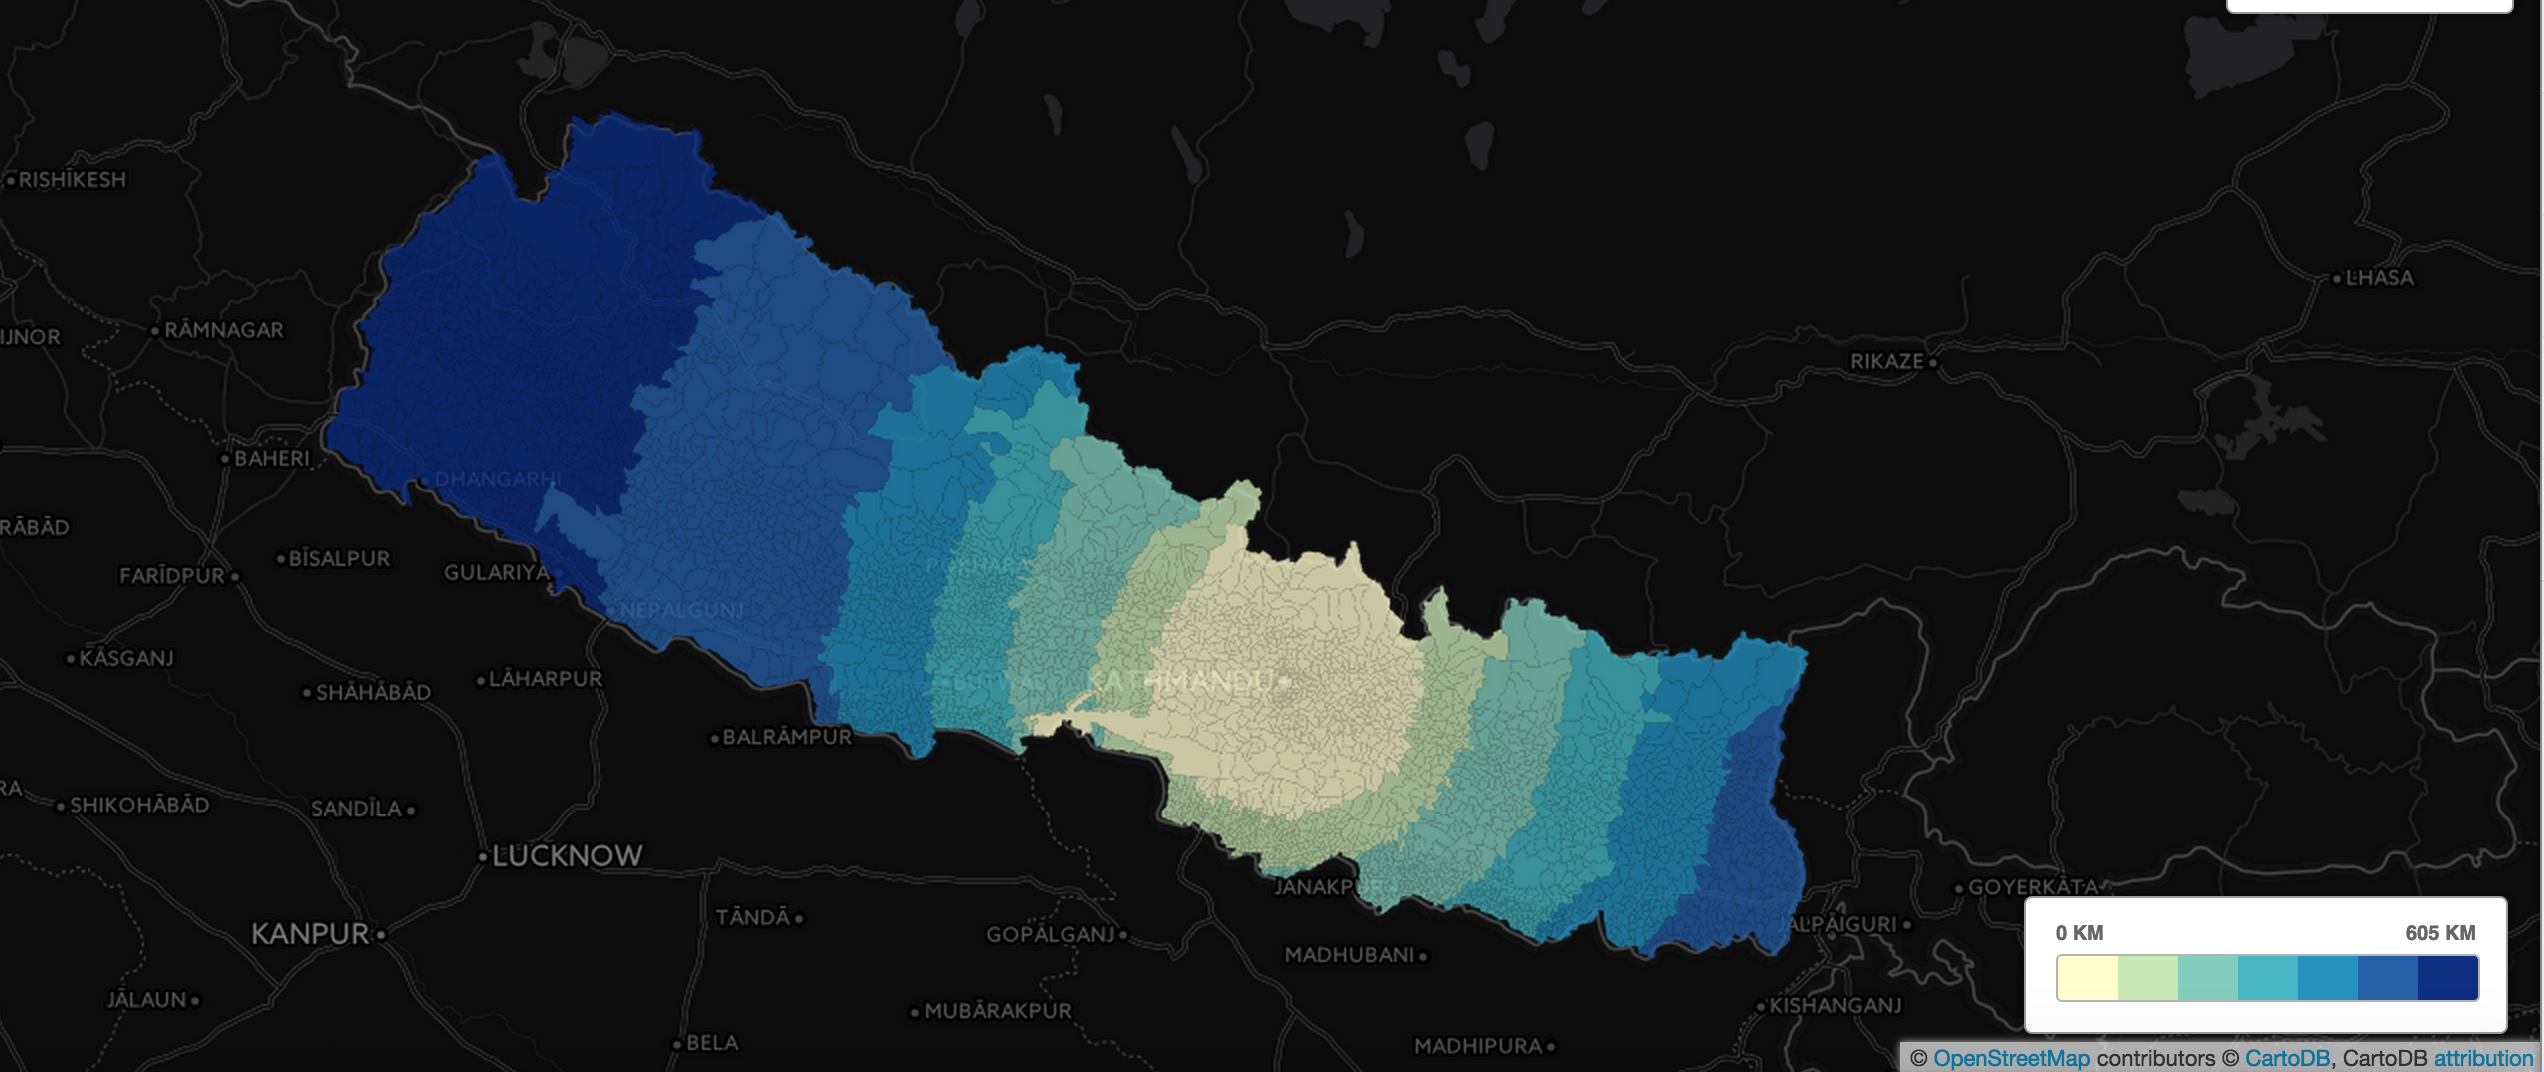
ST_Distance
Find the distance each adm4-level admin area is from Kathmandu.
SELECT
  the_geom_webmercator,
  ST_Distance(
    ST_Transform(
      CDB_LatLng(
        27.7089603,
        85.3261328),
      3857),
    the_geom_webmercator
    ) / 1000 AS d
FROM
  npl_adm4
There’s lots, lots more. New Map Academy lesson going up this week on geospatial data analysis. Watch http://academy.cartodb.com for more.
Intersect Count
You can do a spatial merge of two tables. A new column called intersect_count will be created (if COUNT is chosen). This represents the number of items from one table that fall within a geometrical shape.
Let’s find out how many items in “Projects_Level4” are within districts in nepal_districts2.
First import Projects_Level4:
http://andye.cartodb.com/api/v2/sql?q=SELECT%20*%20FROM%20projects_level4&filename=projects_level4&format=shp
Next, go back to your table view and click on nepal_districts2.
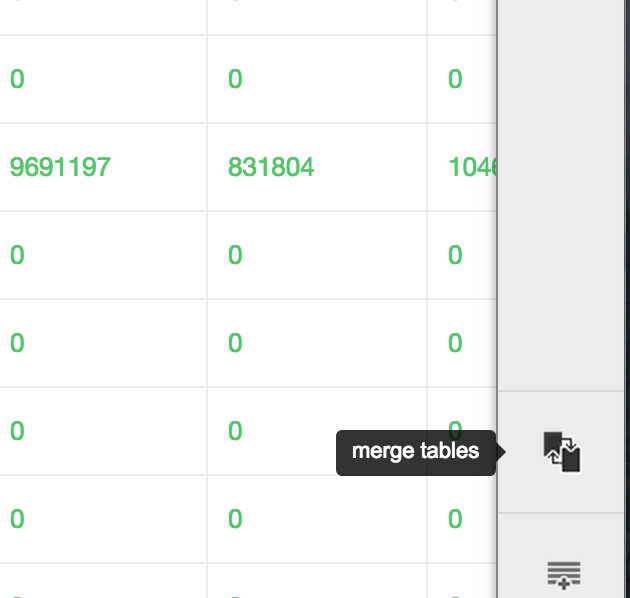
Next, click on “Spatial Join”.
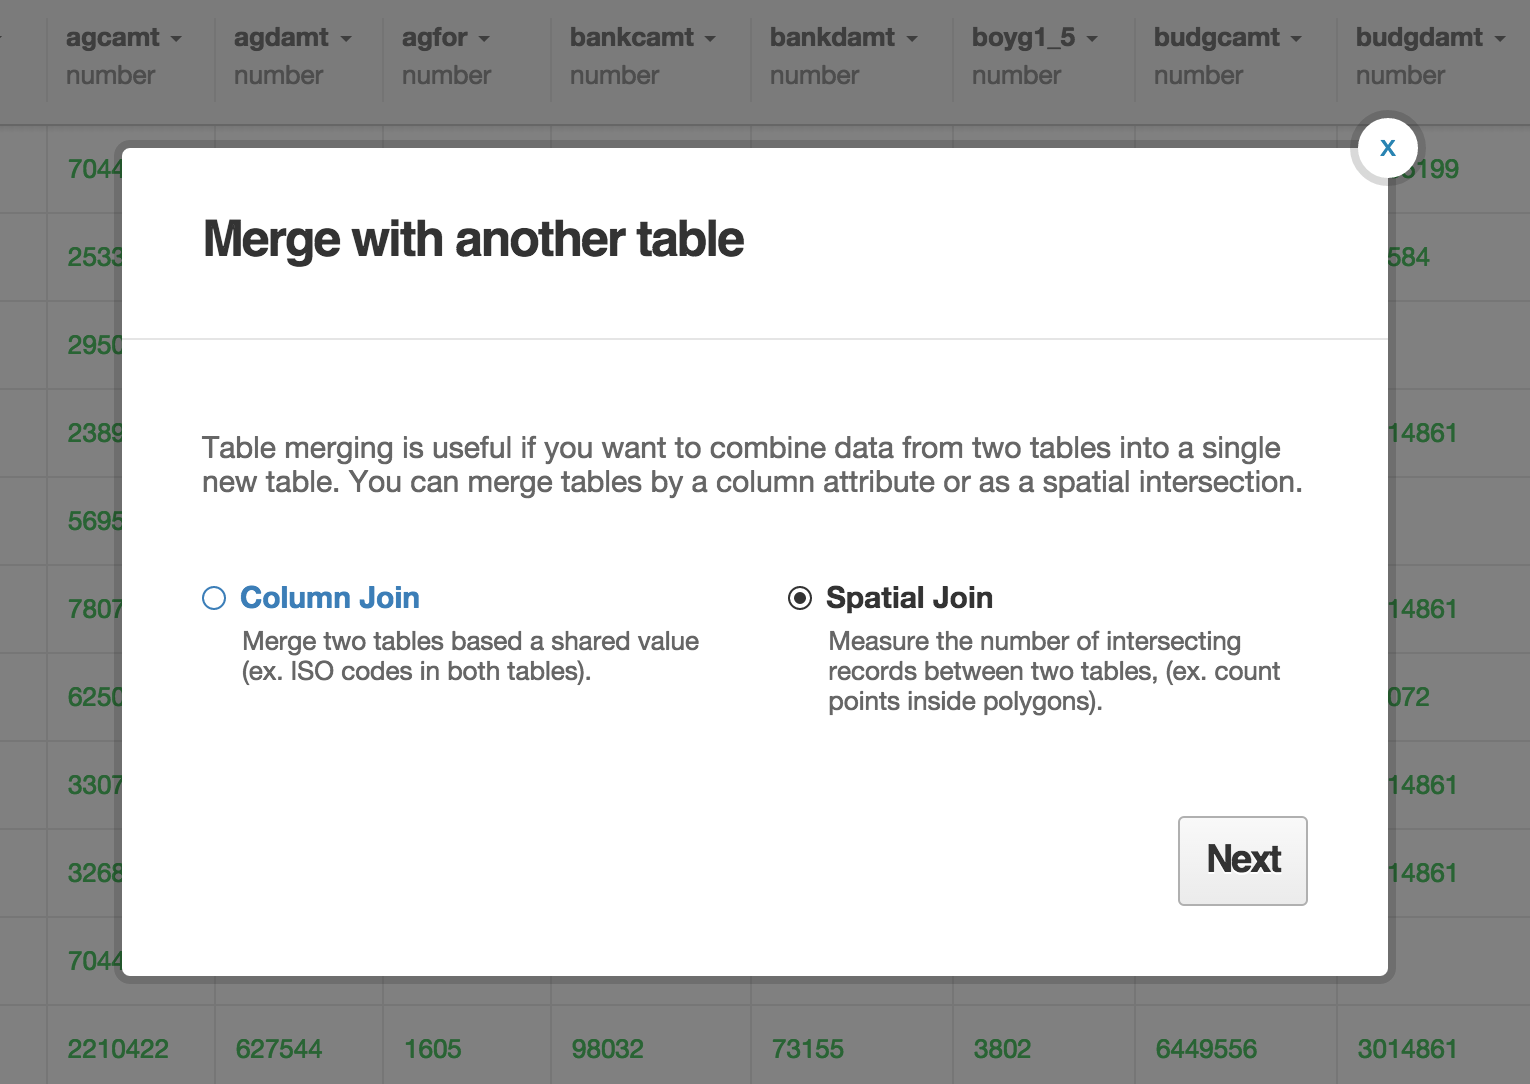
Finally, choose projects_level4 on the right side and hit Merge tables.
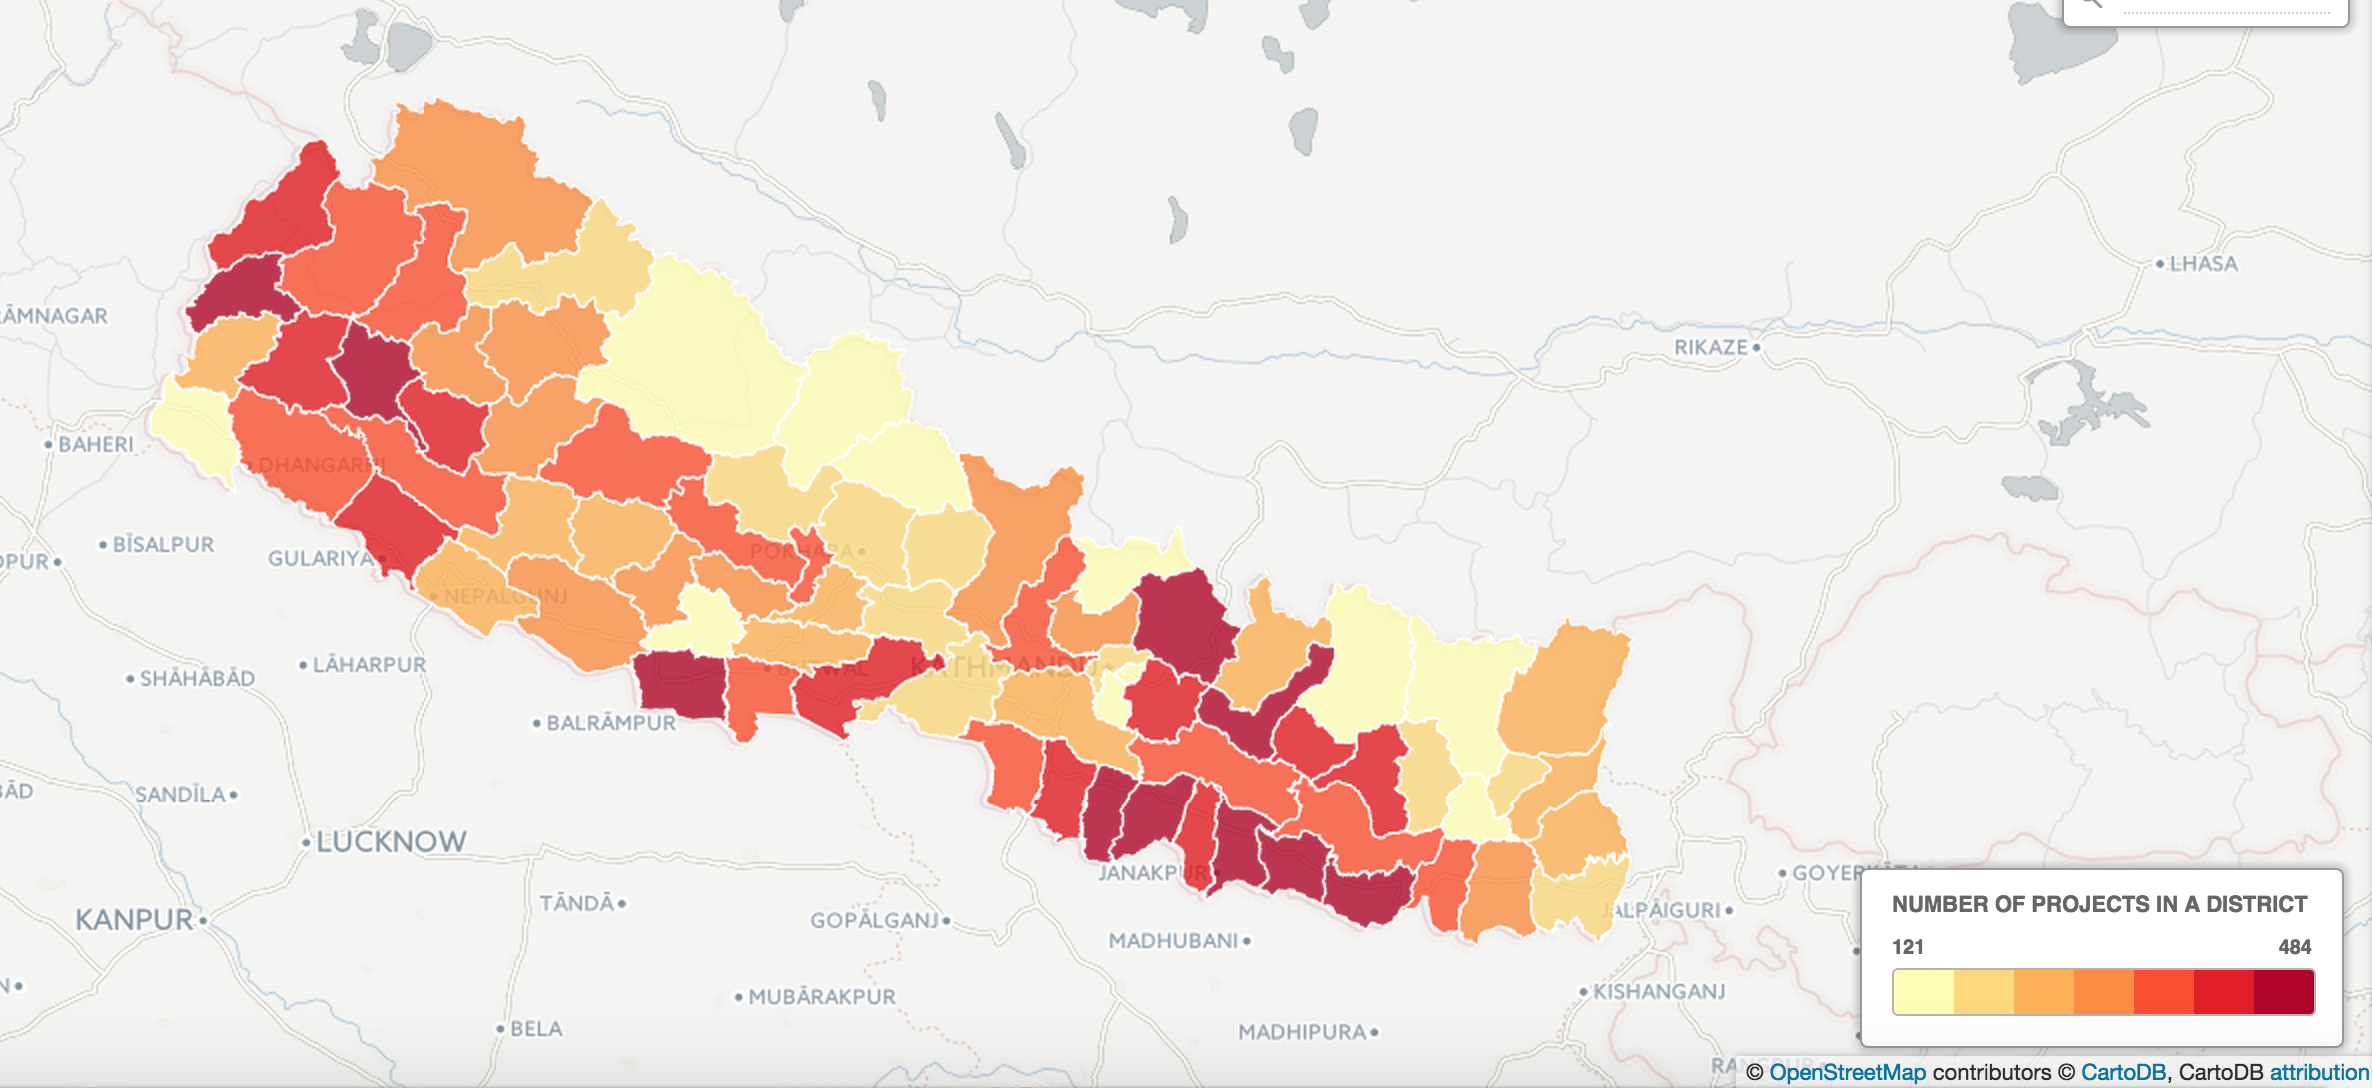
Now you can create a choropleth based on the number of items from Projects_Level4 that occurred within the districts of Nepal. Make sure to select intersection_count for the choropleth column.
Torque – spatio-temporal maps
Requirements:
- Info in
the_geom - A time column (numeric or date type)
Data sets we could use:
- Number of schools
- Number of voters
Examples in the news:
Odyssey – telling narratives with your geospatial data
Huge revamp coming within a week or two.
Example maps:
Resources
- Map Academy
- CartoDB.js – build a web app to visualize your data, allowing for user interaction
- SQL and PostGIS
- Tutorials
- Tips & Tricks
- Community help on StackExchange
Stay in contact
If you make a cool map, send it my way! @MrEPhysics
